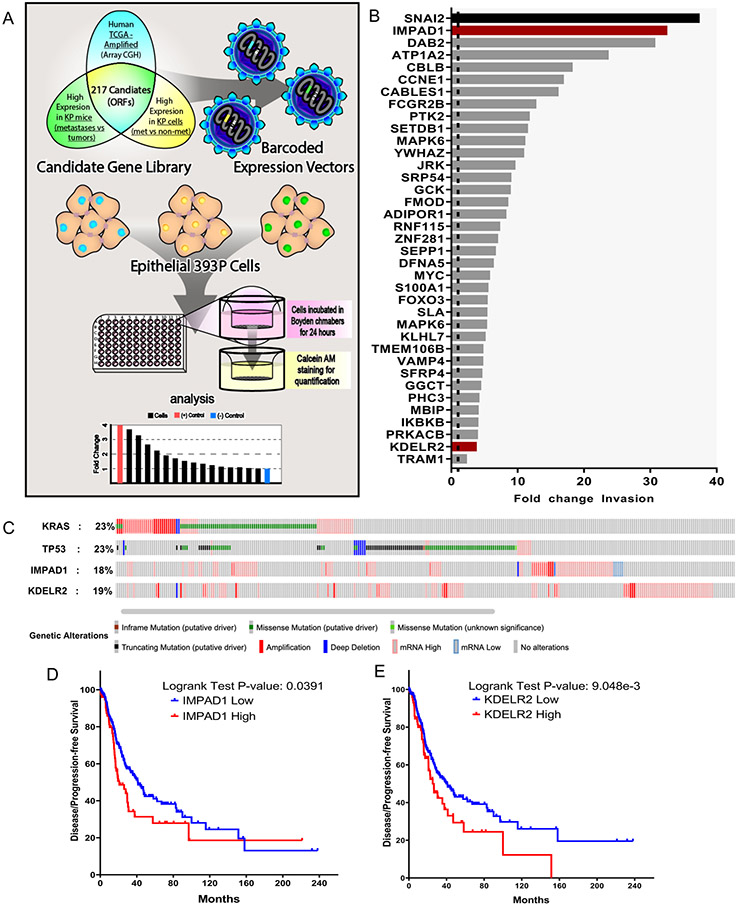
Figure 1. Novel screen identifies IMPAD1 and KDELR2 as drivers of lung cancer invasion and disease progression.
a. Schematic representation of workflow for the in vitro screen. DNA barcoded candidate genes were overexpressed in non-invasive & non-metastatic 393P murine tumor cell line using lentiviral infection. Individual ORF-barcoded cell lines were randomly grouped and individually seeded in quadruplicates in 96-well Boyden chambers. Invaded cells were quantified and plotted as shown in representative histogram. b. Waterfall plot demonstrates 37 hits that showed a significant increase in fold change invasion across all cohorts when compared to mCherry. SNAI2 (in black) used as a positive control and mCherry as a negative control, which is denoted as a dotted line (fold change of 1). IMPAD1 and KDELR2, the hits that also showed a significant change in invasion upon further validation (See also Supplemental Fig. S2) with 3 different migration/invasion assays, are represented as red bars. c. IMPAD1 and KDELR2 amplification and mutation frequency in lung adenocarcinoma (LuAd) in relation to putative LuAd drivers, Kras and Tp53, as reported by TCGA. d-e. Kaplan–Meier survival analysis shows significantly poor outcome in disease-free survival of LuAd patients with increased expression of (d) IMPAD1, and (e) KDELR2. See also Supplemental Fig. S3.

