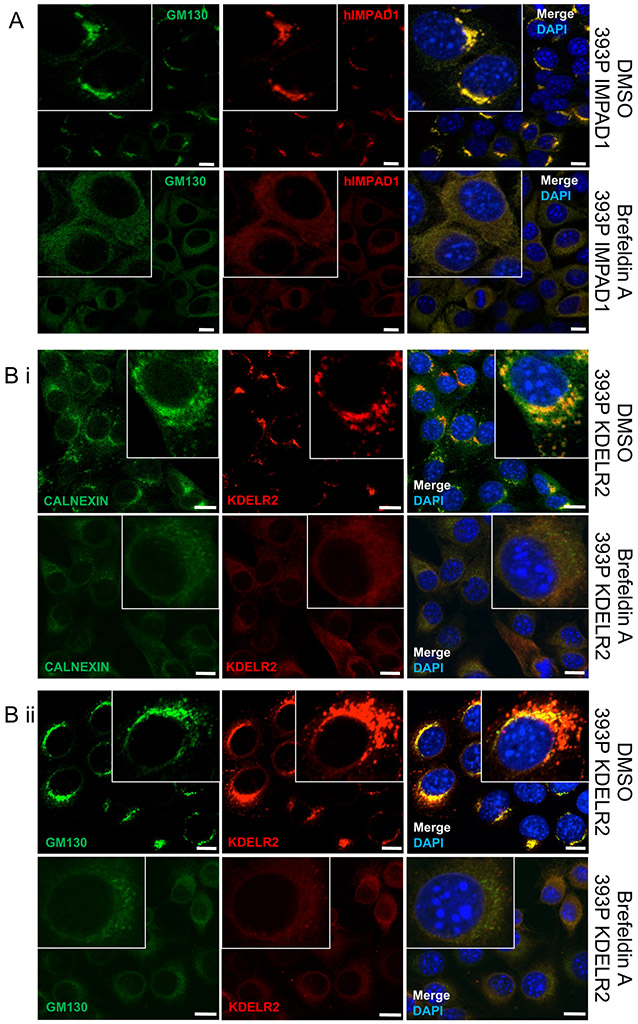
Figure 5. IMPAD1 and KDELR2 localize to the ER-Golgi pathway.
a. Co-immunofluorescence for human IMPAD1 (red) and Golgi marker, GM130 (green) in 393P cells with IMPAD1 overexpression. Nucleus was stained with Dapi. Cells were treated with DMSO (upper) or Brefeldin-A (BFA) at 1uM for 4 hours (lower). IMPAD1 localization to the Golgi is disrupted upon BFA treatment, which abrogates Golgi stacking. b-i. Co-immunofluorescence for FLAG-KDELR2 (red) and Calnexin (green) in 393P cells with mouse KDELR2 overexpression or empty vector control. Cells were treated with DMSO (upper) or Brefeldin-A (1uM 4 hours) (lower). b-ii. Co-immunofluorescence for FLAG-KDELR2 (red) and GM130 (green) in 393P cells with KDELR2 overexpression or empty vector control. Cells were treated with DMSO (upper) or Brefeldin-A (1uM 4 hours) (lower). Nucleus was stained with DAPI. Scale bar for all images:10uM. See also Supplemental Fig. S8.

