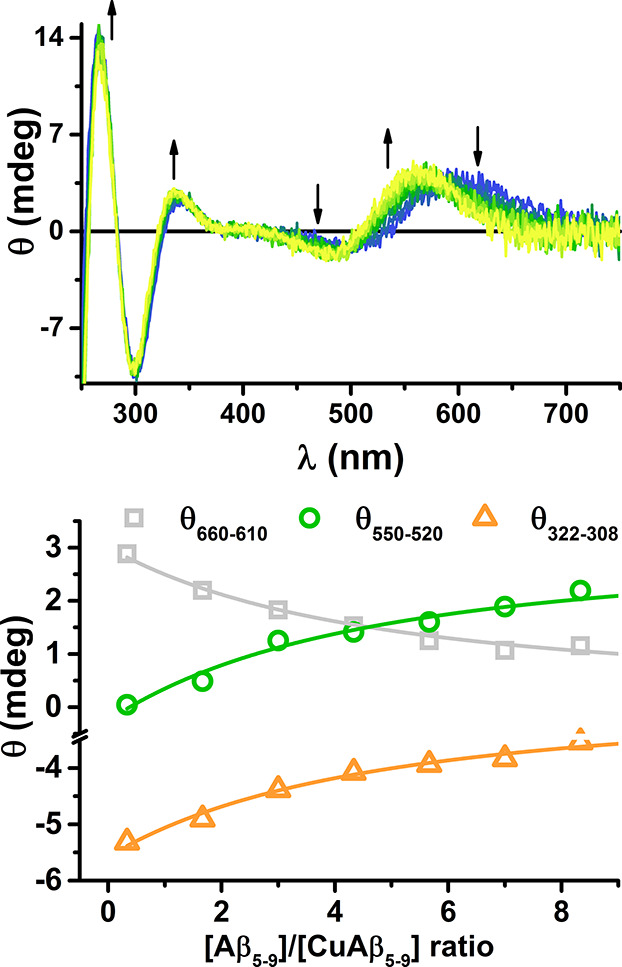
Figure 3.

Top: the titration of 0.8 mM Cu(II) and 1.0 mM Aβ5–9 at 25 °C and pH 7.4 with the excess of Aβ5–9, up to 15 mM, monitored by CD. Arrows mark the direction of changes. Bottom: the fit of the conditional stability constant of the CuL2 complex at spectral areas of maximum change: 635 nm (gray), 535 nm (green), and 315 nm (orange).
