-
A–C
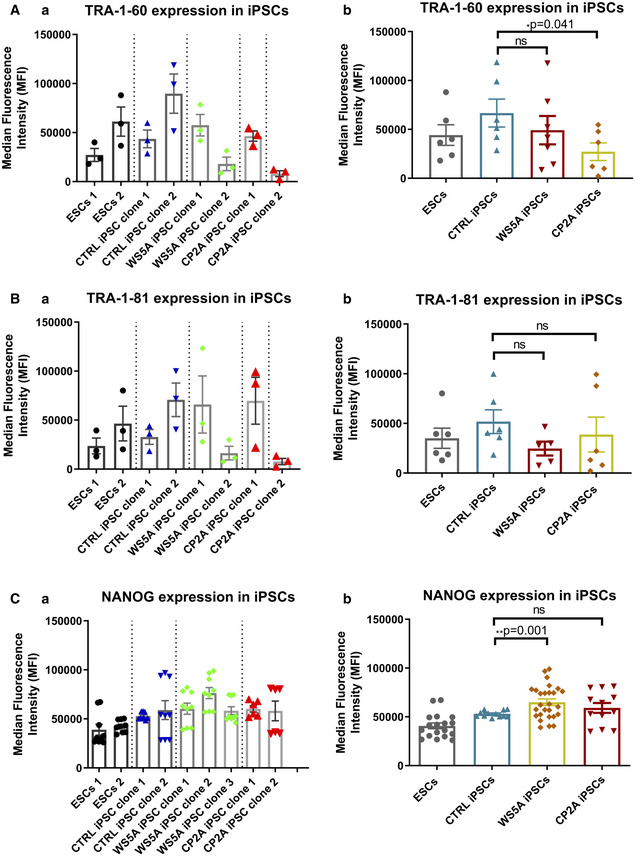
Flow cytometric analysis of expression level of pluripotency markers TRA‐1-60 (A, n = 3, technical replicates per line/clone), TRA‐1-81 (B, n = 3, technical replicates per line/clone), and NANOG (C, n = 9, technical replicates per line/clone for ESCs, control, and WS5A iPSCs; n = 6, technical replicates per clone for CP2A iPSCs) in ESC and iPSC lines. Data are demonstrated as individual clones (left panel, a) and combination as a group for ESCs, CTRL iPSCs, and WS5A and CP2A patient lines (right panel, b).
Data information: The data points in A–C represent 2 ESC lines, 2 different control clones from Detroit 551 iPSCs, 3 different iPSC clones from WS5A patient, and 2 different clones from CP2A patient iPSCs. Data are presented as mean ± SEM for the number of samples. Mann–Whitney
U‐test was used for the data presented in B, b. Two‐sided Student's
t‐test was used for the data presented in A, b and C, b. Significance is denoted for
P values of less than 0.05. *
P < 0.05; **
P < 0.01.
Source data are available online for this figure.

