-
A
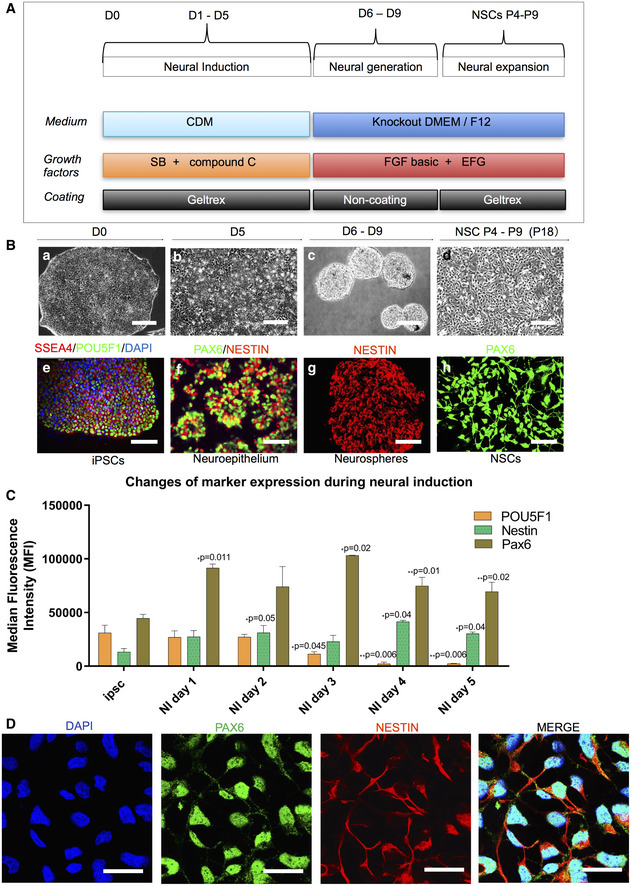
Schematic of dual differentiation and seeding paradigm for NSCs via the dual SMAD protocol.
-
B
Representative phase contrast images (upper panel) and immunostaining for specific stages during neural induction from iPSCs to NSCs. Upper panel displays the morphology in culture of different cell types during neural induction to NSCs from iPSCs including iPSCs (a); neuroepithelium with rosette‐like structures (b); neurospheres with defined round shapes in suspension culture (c); and NSCs in monolayers (d) (scale bars, 50 μm). Lower panel demonstrates the representative phase contrast images for the immunostaining corresponding to the specific stages in the upper panel: iPSCs with positive staining of SSEA4 (red) and POU5F1 (green) (e) (scale bar, 50 μm); neuroepithelium with rosette‐like structures with positive staining of PAX6 (green) and NESTIN (red) (f) (scale bar, 50 μm); neurospheres with positive staining of NESTIN (red) (g) (scale bar, 100 μm); NSCs with positive staining of PAX6 (green) (h) (scale bar, 50 μm).
-
C
Flow cytometric assessment of stemness marker POU5F1 and NSC markers NESTIN and PAX6 during neural induction from day 0 to day 5 (n = 3, technical replicates).
-
D
Representative images of the immunofluorescent labeling for NSC markers SOX2 (green) and NESTIN (red) (scale bar, 25 μm) from Detroit 551 control iPSC‐derived NSCs. Nuclei are stained with DAPI (blue).
Data information: The data presented in C were generated from one iPSC clones (clone 1) from Detroit 551 control. Data are presented as mean ± SEM for the number of samples. Mann–Whitney
U‐test was used to test the significant difference in the expressions of days 1–5 compared to day 0. Significance is denoted for
P values of less than 0.05. *
P < 0.05; **
P < 0.01.
Source data are available online for this figure.

