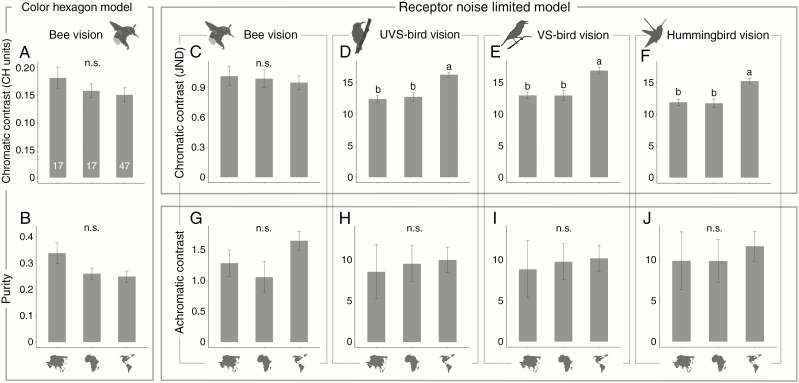
Fig. 4.
Comparisons of parameters of colour conspicuousness between bird-pollinated red flowers from Asia, Africa and the Americas (indicated by small maps under the columns) according to different colour vision models. The RNL model was used for both bees and birds, and the CH model was used in addition for bees. (A, B) Chromatic contrast and purity in bees’ vision according to the CH model. (C–F) Chromatic contrast in bees’, UVS birds’, VS birds’ and hummingbirds’ vision according to the RNL model. (G–J) Achromatic contrast in bees’, UVS birds’, VS birds’ and hummingbirds’ vision. phylANOVAs (with 1000 simulations and Holm’s method for P-value adjustment) were used. Values are shown as mean ± s.e. Different letters above the error bars indicate significant differences (n.s., not significant). The numbers at the bottom of the columns in (A) are sample sizes.

