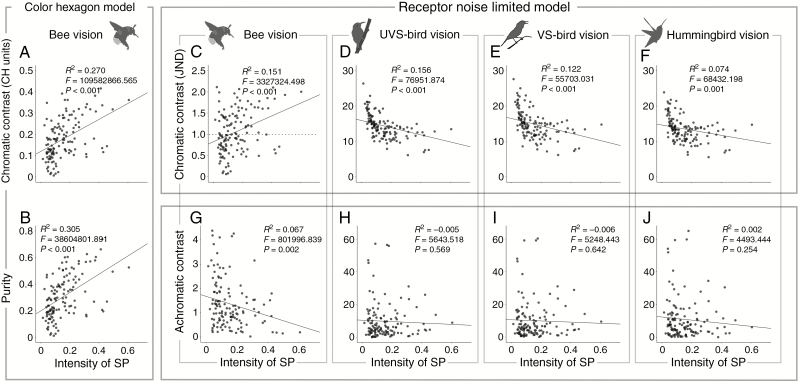
Fig. 6.
Relationship between floral parameters and the intensity of SPs. Relationship between SP intensity and (A, B) chromatic contrast (A) and purity (B) in bees’ vision according to the CH model; (C–E) chromatic contrast in bees’ (C), UVS birds’ (D), VS birds’ (E) and hummingbirds’ (F) vision according to the RNL model; and (G–J) achromatic contrast in bees’ (G), UVS birds’ (H), VS birds’ (I) and hummingbirds’ (J) vision. Phylogenetic regressions were performed using the function pgls in the package caper. The dashed line in (C) illustrates the theoretical discrimination threshold (1 JND) in the RNL model.

