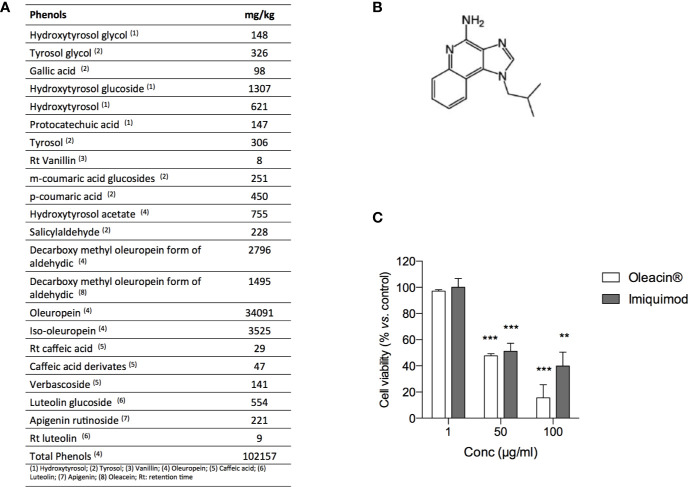
Figure 5.
Oleacin® and Imiquimod decrease 501Mel cell viability. (A) Polyphenol composition of Oleacin®. (B) Chemical structure of Imiquimod. (C) 501Mel cells were treated with 1, 50, and 100 µg/ml of either Oleacin® or Imiquimod. Growth inhibition was measured at 72 h using the MTS assay and is expressed as percentage of Ctrl (corresponding vehicle-treated cells). Data are presented as means ± SD of three independent experiments, each performed in triplicate. Student-t test was performed, **p < 0.01; ***p < 0.001 compared to the corresponding control.

