FIGURE 2.
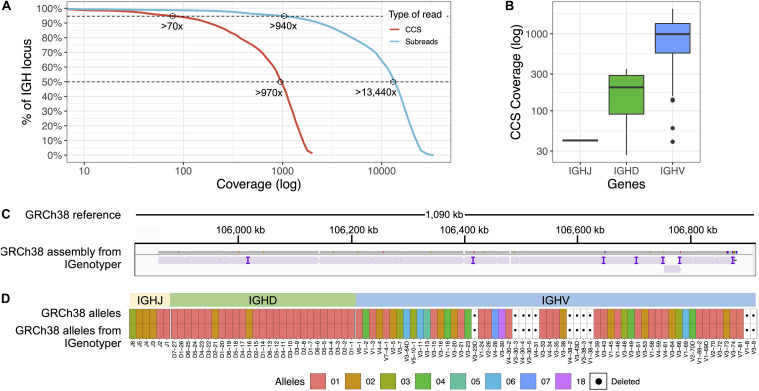
Benchmarking targeted long-read sequencing and assembly in a haploid DNA sample. (A) The empirical cumulative subread (blue) and CCS (red) coverage in IGH from the combined CHM1 dataset. The subread coverage for 95 and 50% (dotted line) of the locus is greater than 940× and 13,440×, and the CCS read coverage for 95 and 50% of the locus is greater than 70× and 970×, respectively. (B) CCS coverage across IGHJ, IGHD and IGHV genes. The average CCS coverage of IGHV genes was >1,000×. (C) IGenotyper assembly of CHM1 aligned to GRCh38. Purple tick marks represent indels in the IGenotyper assembly relative to GRCh38. (D) IGHJ, IGHD, and IGHV alleles detected by IGenotyper in CHM1 compared to alleles previously annotated in GRCh38.

