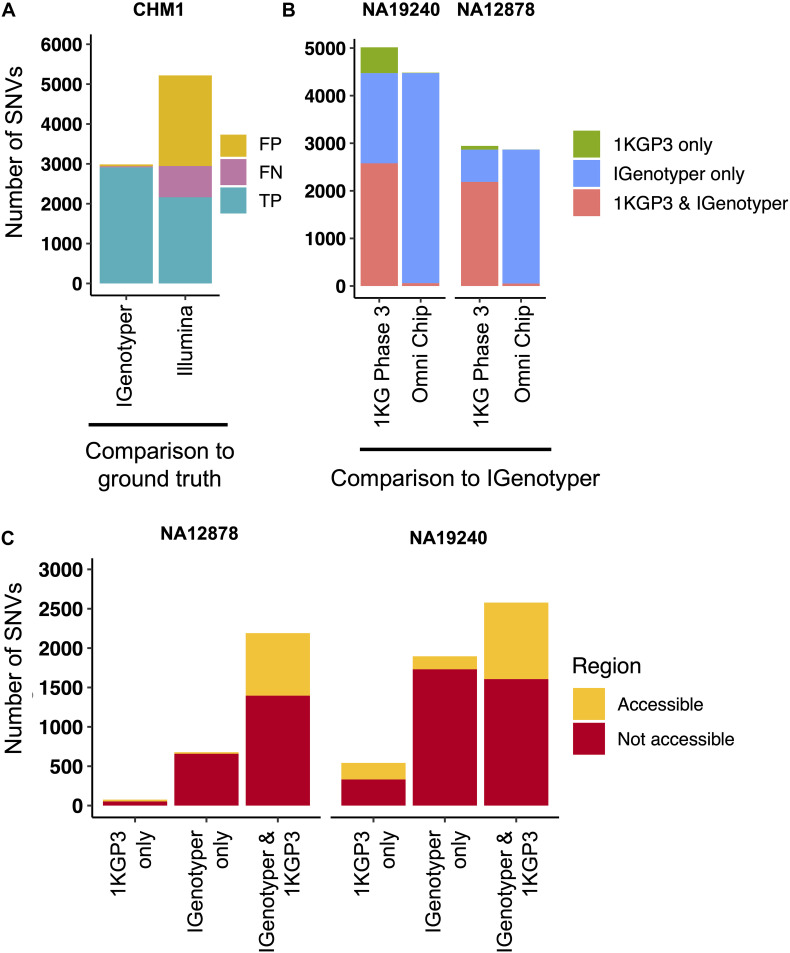
FIGURE 4.
Comparison of SNVs identified by IGenotyper to SNVs called using short-read and microarray data. (A) SNVs detected by IGenotyper and Illumina/GATK in CHM1 were compared to a CHM1 ground truth SNV dataset; numbers of false-negative, false-positive, and true-positive SNVs in each callset are shown. (B) SNVs in the 1KGP Phase 3 (1KGP3) datasets were compared to SNVs detected by IGenotyper in NA19240 and NA12878. The total number of SNVs in each bar sums to the number of overlapping SNVs and the number of SNVs unique to each dataset. (C) SNVs found by IGenotyper and the 1KGP dataset, found only by IGenotyper and found only in the 1KGP dataset were partitioned into regions identified as accessible by the 1KGP accessible genome browser track.

