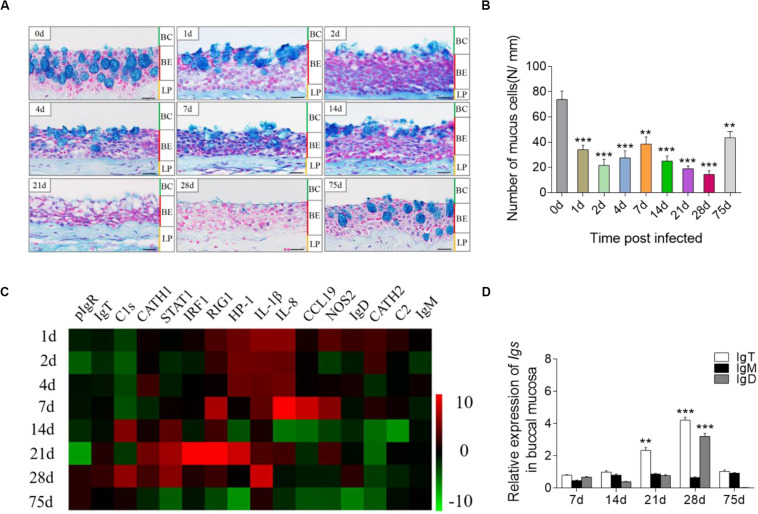
FIGURE 2.
Pathological changes and immune response in the trout BM after infection with F. columnare. (A) Histological examination by AB staining of BM from trout infected with F. columnare after 1, 2, 4, 7, 14, 28, and 75 days and uninfected control fish (n = 6 fish per group). (B) The number of mucus cells per millimeter in the buccal epithelium of F. columnare-infected rainbow trout at 1, 2, 4 7, 14, 21, 28, and 75 days and control fish (n = 6 fish per group), counted in 25 fields from (A). (C) Heat map illustrates results from quantitative real-time PCR of mRNAs for selected immune markers in F. columnare-infected fish versus control fish measured at days 1, 2, 4, 7, 14, 21, 28, and 75 post-infection (n = 6 per group) in the BM of rainbow trout. Data are expressed as mean fold increase in expression. (D) Relative expression of IgT, IgM, and IgD at days 1, 7, 28, and 75 post-infection with F. columnare in trout BM (n = 6 fish per group). BC, buccal cavity; BE, buccal epithelium; and LP, lamina propria. Scale bars, 20 μm. **P < 0.01, ***P < 0.001 (unpaired Student’s t-test). Data are representative of three independent experiments (mean ± SEM).

