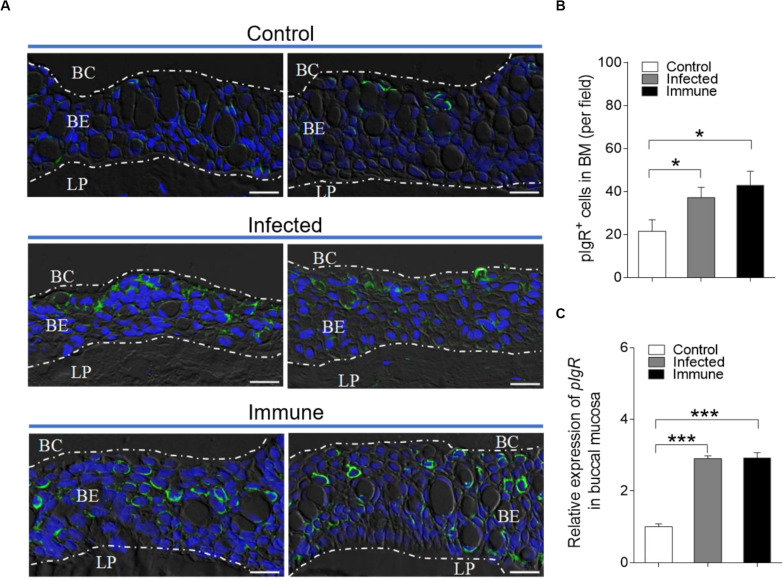
FIGURE 6.
Accumulation of pIgR+ cells in the BM of trout after infected with F. columnare. (A) DIC images of immunofluorescence staining on trout BM paraffinic sections from control (top), infected (28 dpi, middle), and immune (75 dpi, bottom) fish, stained for pIgR (green) and nuclei with DAPI (blue; n = 12 fish per group; isotype-matched control antibody staining, Supplementary Figure S4 in Supporting Information). (B) The number of pIgR+ cells in trout BM paraffin sections of control, infected (28 dpi), and immune (75 dpi) fish (n = 12 fish per group), counted in 20 fields from (A). (C) Relative mRNA expression of pIgR in the BM of control, infected and immune fish were detected by qRT-PCR (n = 6 fish per group). BC, buccal cavity; BE, buccal epithelium; and LP, lamina propria. Scale bar, 20 μm. *P < 0.05 and ***P < 0.001 (one-way ANOVA with Bonferroni correction). Data in (B,C) are representative of at least three independent experiments (mean ± SEM).

