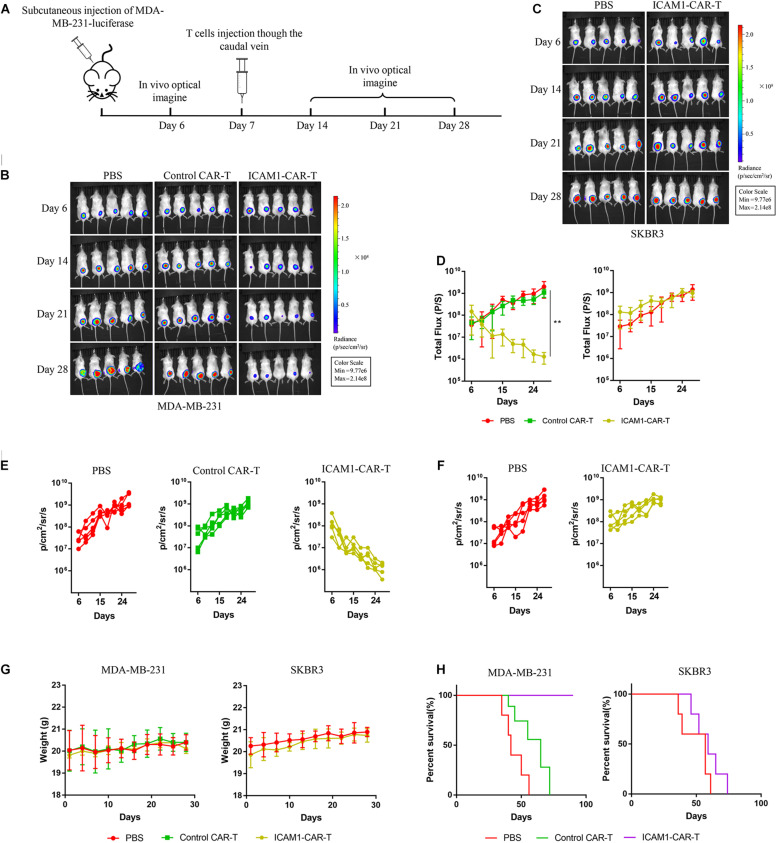
FIGURE 5.
Antitumor effect of ICAM1-specific CAR-T cells in xenograft models. (A) Treatment scheme used in the MDA-MB-231-luc and SKBR3-luc xenograft models. (B,C) An image of the MDA-MB-231-luc and SKBR3-luc allograft tumor, respectively, in mice (five mice per group). (D) Tumor total flux data (in p/s) were calculated using Living Image software. Tumor growth rates are shown as mean values (unpaired two-tailed Student’s t-tests, **p < 0.01). (E,F) Fluorescence intensity changes of MDA-MB-231-luc and SKBR3-luc heterologous tumors in mice. (G) Body weight measurements during the treatment. (H) Overall survival of mice in each group.

