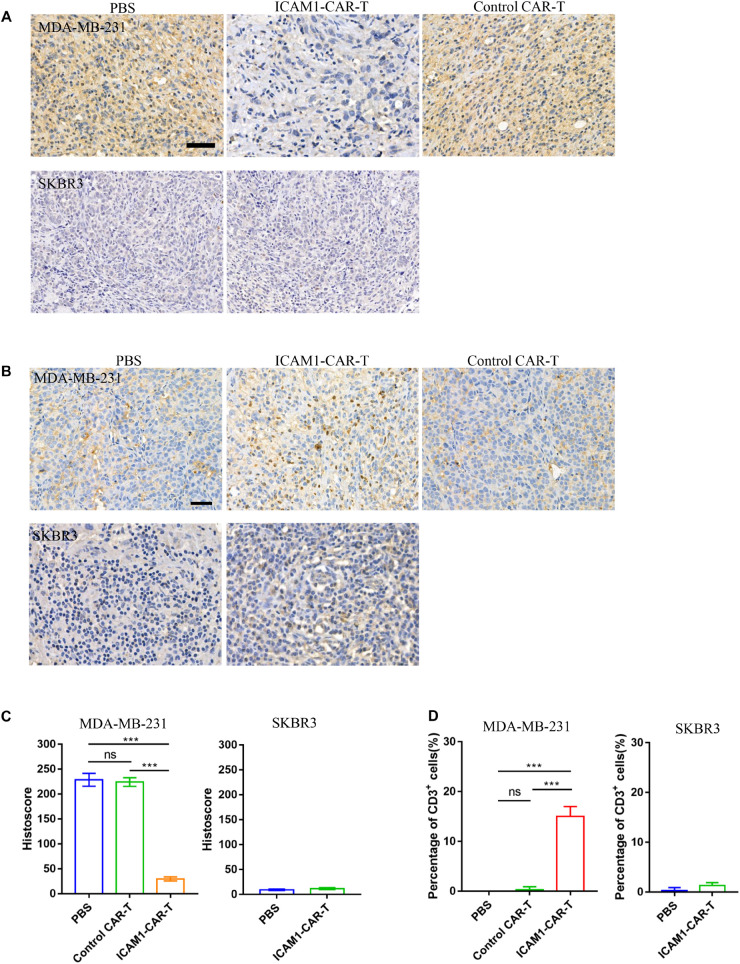
FIGURE 7.
Immunohistochemistry of CD3 and ICAM1 in mouse tumor tissue. (A) Representative images of ICAM1 IHC staining in tumor sections after treatment. Scale bars = 50 μm. (B) Detection of CD3 on tumor tissue from the MDA-MB-231 and SKBR3 xenograft mouse models. (C) ICAM1 staining intensities in all treatment groups from the MDA-MB-231 and SKBR3 xenograft mouse models. (D) Determination of the number of CD3-positive cells by cell counting. Each datum represents three independent experiments (bar value represents the dispersion degree, ***p < 0.001).

