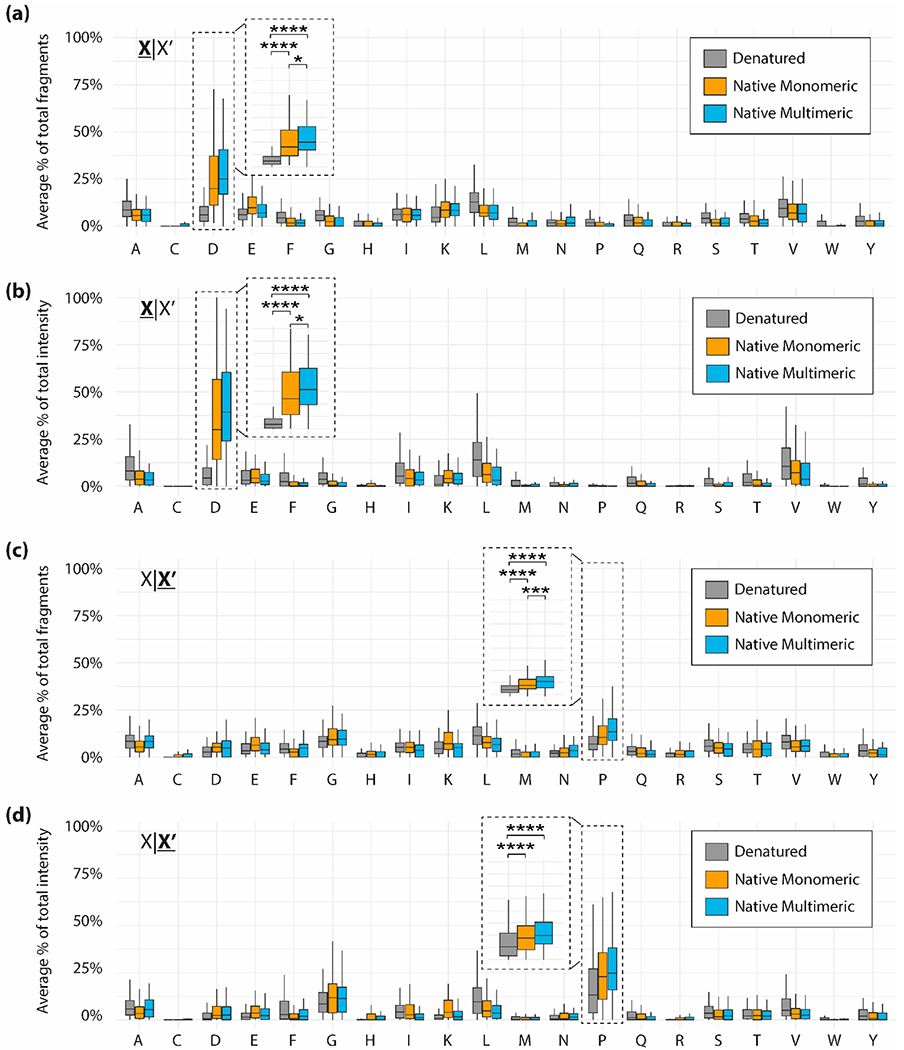
Figure 2.

Average percent of total fragments (a) or total fragment intensity (b) contributed by each residue N-terminal (X|X′) to the fragmentation site. Average percent of total fragments (c) or total fragment intensity (d) contributed by each residue C-terminal (X|X′) to the fragmentation site. Data are divided into denatured proteins (gray), native monomeric proteins (gold), and native multimeric proteins (blue). Brackets indicate a comparison between two data points using a Wilcoxon–Mann–Whitney test. Significant differences are denoted as follows: p ≤ 0.05 is denoted by one asterisk, p ≤ 0.01 is denoted by two asterisks, p ≤ 0.001 is denoted by three asterisks, p ≤ 0.0001 is denoted by four asterisks.
