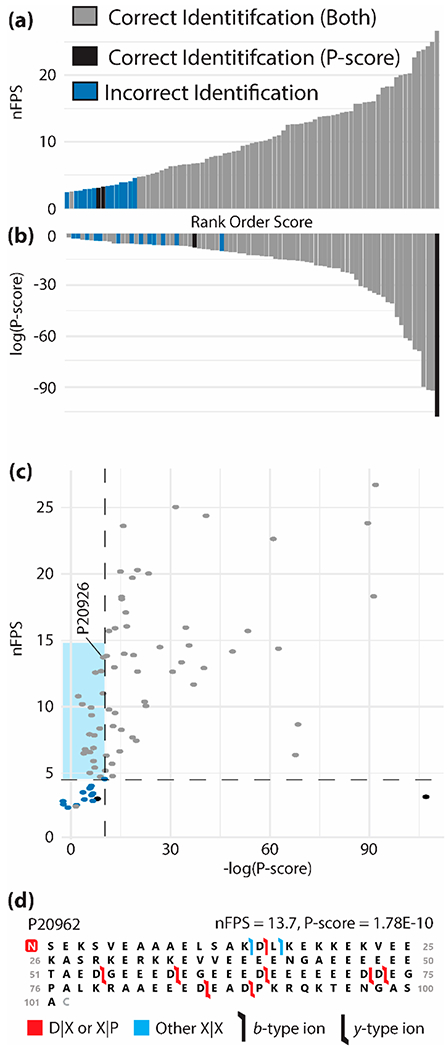
Figure 5.

(a) nFPS and (b) P-score assigned to searched “true positive” native monomeric proteoforms in rank order of score value. (c) nFPS versus P-score, each point represents a single proteoform. Proteoforms are divided into those identified correctly by both scores (gray), by only the P-score (black), or incorrectly identified by both scores (blue). (d) Fragmentation map for parathymosin (P20962); the red box denotes N-terminal acetylation. Flags represent identified fragment ions and are colored red to denote a D|X or X|P fragment ion or blue for a fragment ion between any other residue pair. Flag directionality denotes a b-type (left to right) or y-type (right to left) ion.
