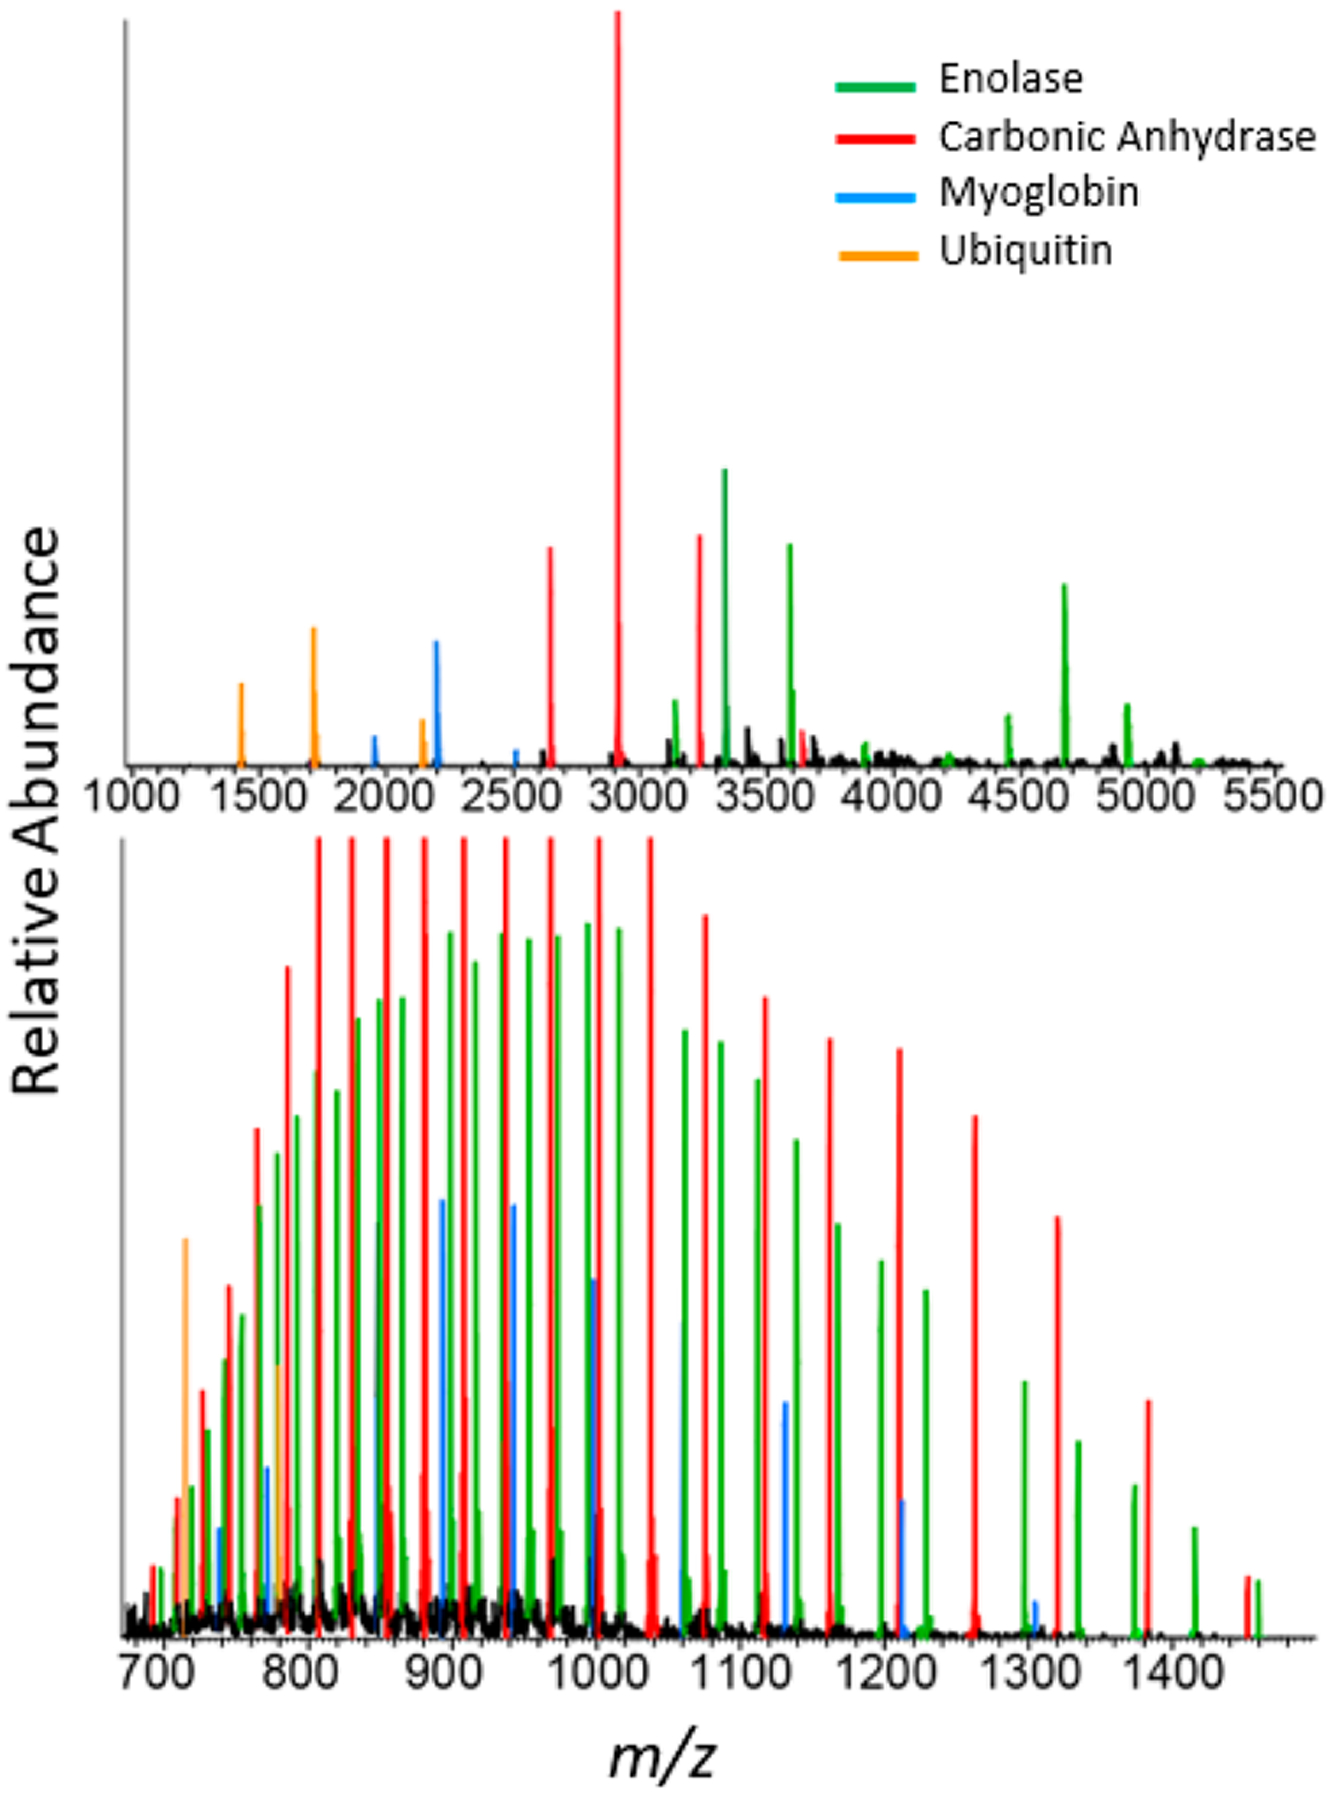
Figure 6.

Mixture of enolase (green), carbonic anhydrase (red), myoglobin (blue), and ubiquitin (orange) under native (top panel) and denaturing (bottom panel) electrospray ionization conditions. Under native conditions enolase forms dimer and monomer charge state distributions at higher and lower m/z values, respectively.
