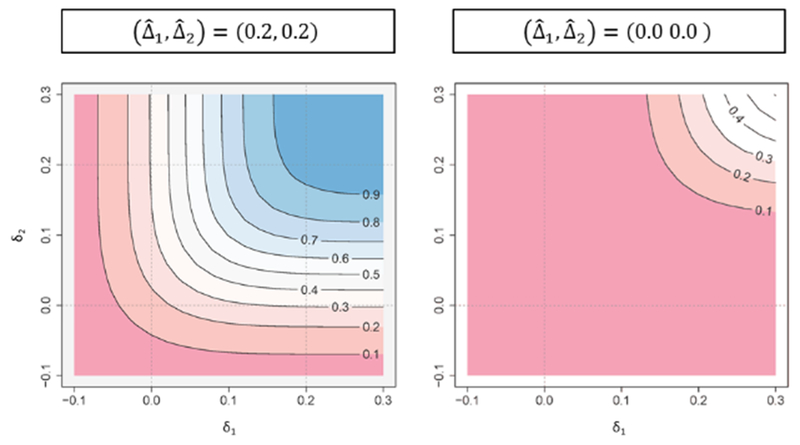
Figure 2.

Conditional power contour plot based on the observed effect size ((0.2, 0.2) or (0.0, 0.0)) when 258 participants are observed (the planned sample size is 516). The horizontal axis (δ1) and the vertical axis (δ2) represent the assumed effect sizes.
