
Figure 3.
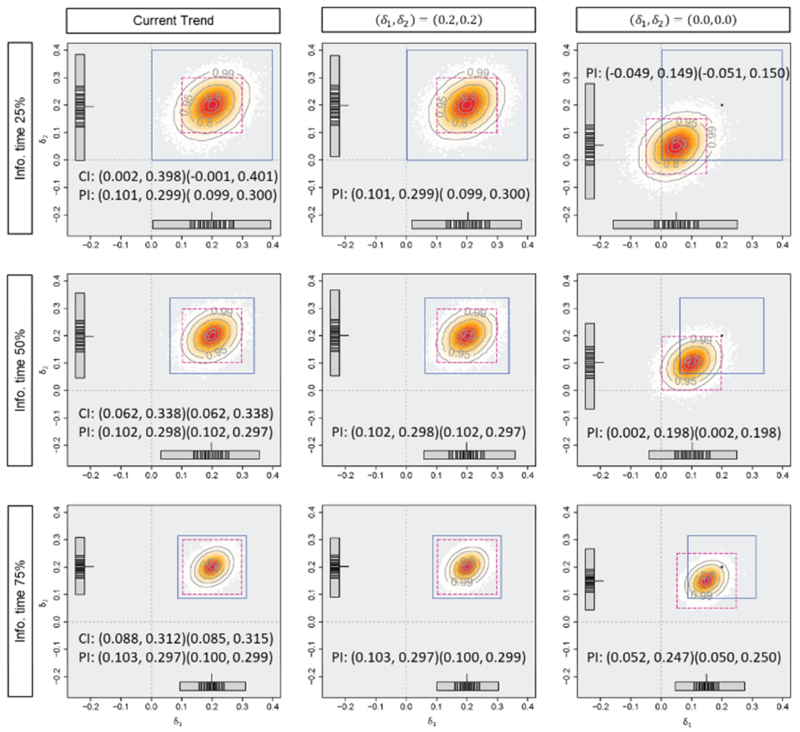
Predicted mean difference estimates and average 95% predicted intervals with the observed mean difference of (i) (0.2, 0.2), the standard deviation of 1.0 and the correlation of 0.3 at 0.25, 0.50 and 0.75 information time in Tarenflurbil trial. The horizontal axis (δ2) and the vertical axis (δ2) represent the effect sizes. The number of generated datasets is 100000.