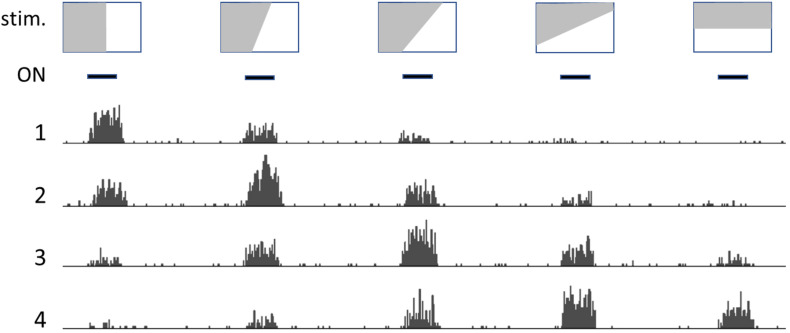
FIGURE 1.
Drawing that illustrates how neurons detect relations (patterns). Depiction of the activity of neighboring neurons in the visual cortex: top row shows representative images, that are presented one after the other at the times indicated by the black bars (ON, second row). Numbers 1 to 4 represent histograms of spike frequencies in recordings from neighboring neurons. Each neuron preferentially responds to a profile with a specific slant angle. However, pattern detection is not crisp and absolute, but rather fuzzy and “tentative.”

