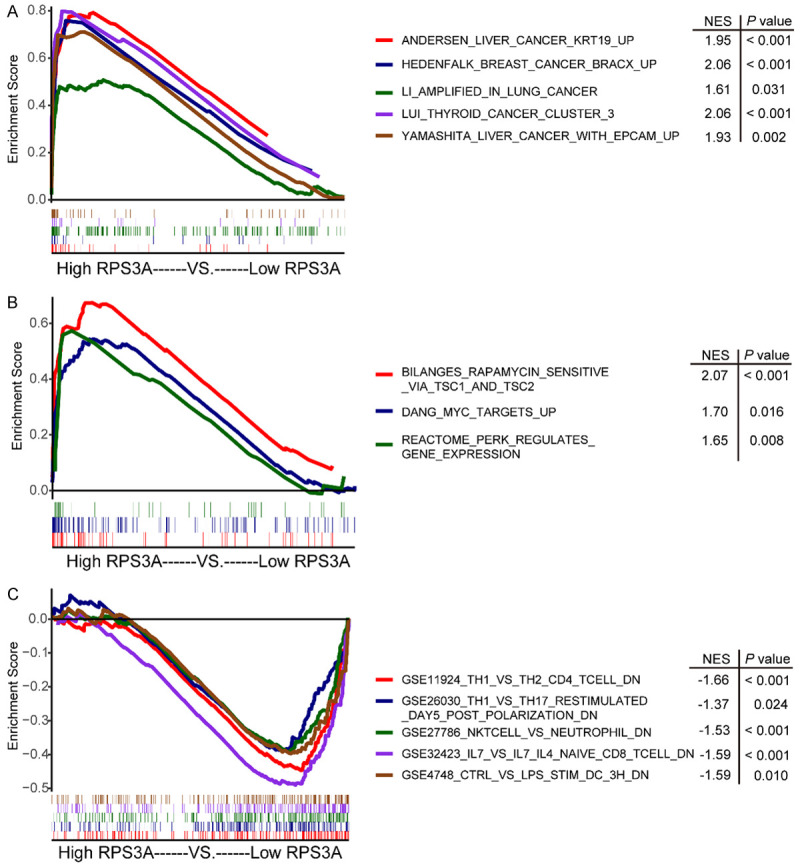
Figure 4.

Biological pathways and processes that RPS3A may be involved in. A, B. GSEA of c2 (curated) gene sets from the MSigDB molecular signatures database in high versus low RPS3A-expressing tumors. C. GSEA of c7 (immunologic) gene sets from MSigDB in high and low RPS3A-expressing tumors. The different curve colors represent different gene signatures. The lower horizontal bars mark the genes in corresponding gene sets.
