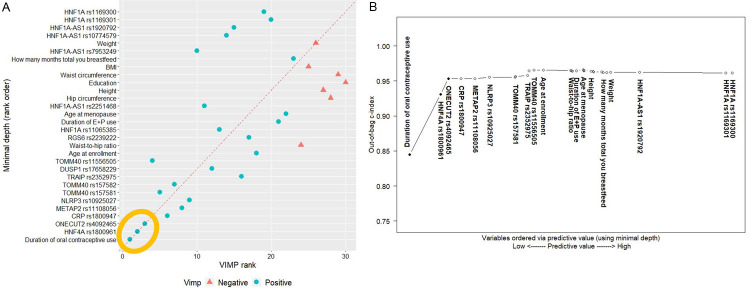
Figure 2.
Overall analysis: the second stage of random survival forest (RSF) analysis with 18 single-nucleotide polymorphisms and 12 behavioral factors selected from the first stage of RSF. A. Comparison of minimal depth and VIMP rankings. (BMI, body mass index; E+P, exogenous estrogen + progestin; VIMP, variable of importance. Note: The 3 variables within the gold ellipse were identified as the most influential predictors. B. Out-of-bag concordance index (C-index). (Improvement in the out-of-bag C-index was observed when the top 3 variables [●] were added to the model, whereas other variables [○] did not further improve the accuracy of prediction).

