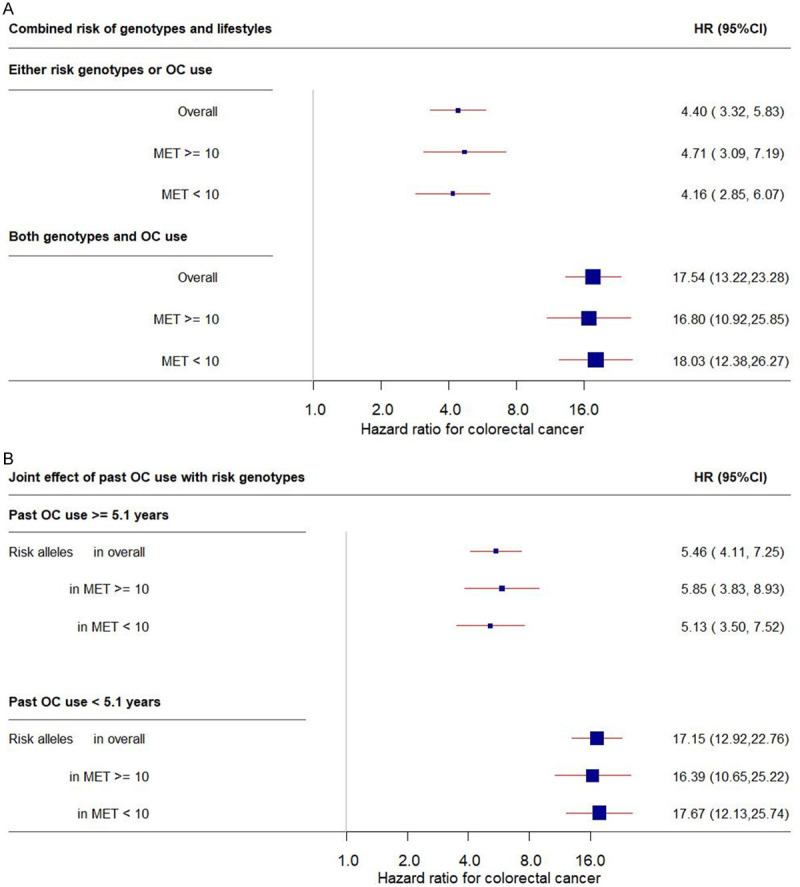
Figure 4.

Forest plot of the combined (A) and joint (B) effect of past OC use and risk genotypes on CRC risk overall and in MET subgroups. Plot (A) shows the independent and combined effect of risk genotypes and OC use on CRC risk, and Plot (B) shows the joint tests for risk genotypes with OC use, presented as the 95% CIs (indicated with red lines) and the estimates (proportional to the size of the blue squares). The analyzed risk genotypes included ONECUT2 rs4092465 GA and HNF4A rs1800961 TT. (CI, confidence interval; CRC, colorectal cancer; HR, hazard ratio; MET, metabolic equivalent; OC, oral contraceptive).
