
Figure 3.
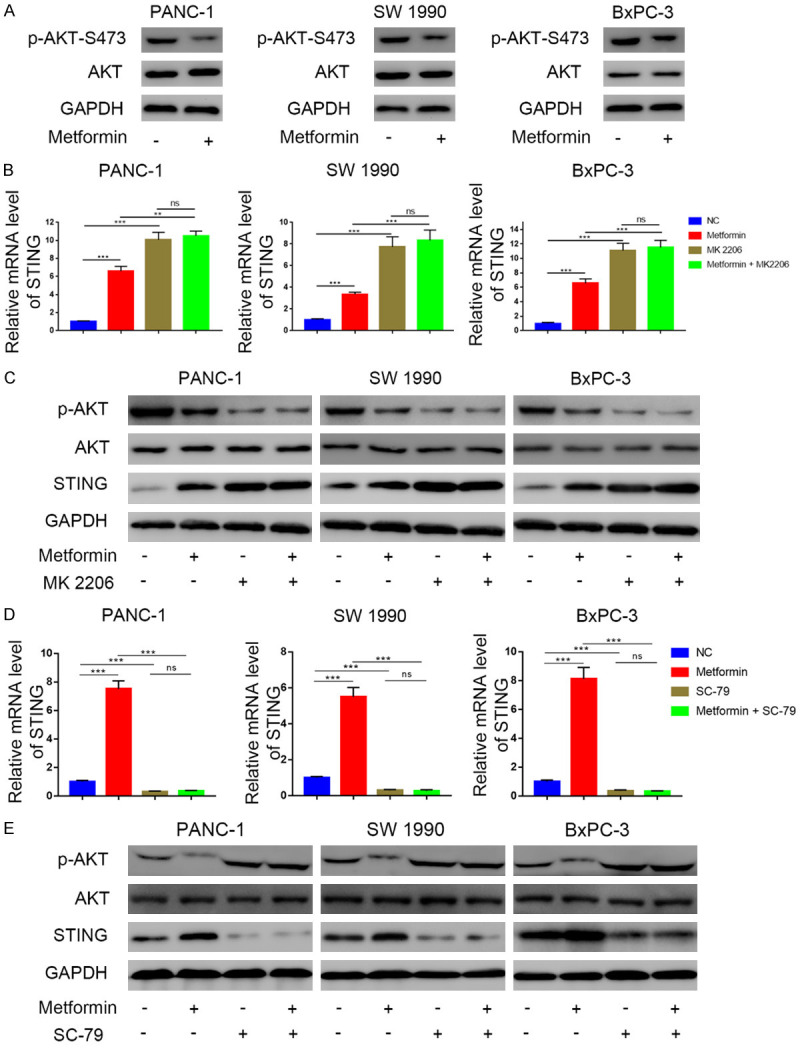
The promotion of metformin towards STING is driven by the suppression of phosphorylation level of AKT in pancreatic cancer. A. Western blot analysis to show the protein expression level of AKT and p-AKT in PANC-1, SW1990 and BxPC-3 cell lines with or without treatment with metformin (5 mM) for 24 h. GAPDH served as an internal reference. B. RT-PCR analysis to show the mRNA expression level of STING in PANC-1, SW1990 and BxPC-3 cell lines treated with metformin (5 mM), MK2206 (10 μM), or the combination of metformin (5 mM) and MK2206 (10 μM). Data presented as the mean ± SD of three independent experiments. ns, not significant; **, P < 0.01; ***, P < 0.001. C. Western blot analysis to show the protein expression level of p-AKT, STING in PANC-1, SW1990 and BxPC-3 cell lines treated with metformin (5 mM), MK2206 (10 μM), or the combination of metformin (5 mM) and MK2206 (10 μM). GAPDH served as an internal reference. D. RT-PCR analysis to show the mRNA expression level of STING in PANC-1, SW1990 and BxPC-3 cell lines treated with metformin (5 mM), SC79 (20 μM), or the combination of metformin (5 mM) and SC79 (20 μM). Data presented as the mean ± SD of three independent experiments. ns, not significant; **, P < 0.01; ***, P < 0.001. E. Western blot analysis to show the protein level of p-AKT, STING in PANC-1, SW1990 and BxPC-3 cell lines treated with metformin (5 mM), SC79 (20 μM), or the combination of metformin (5 mM) and SC79 (20 μM). GAPDH served as an internal reference.