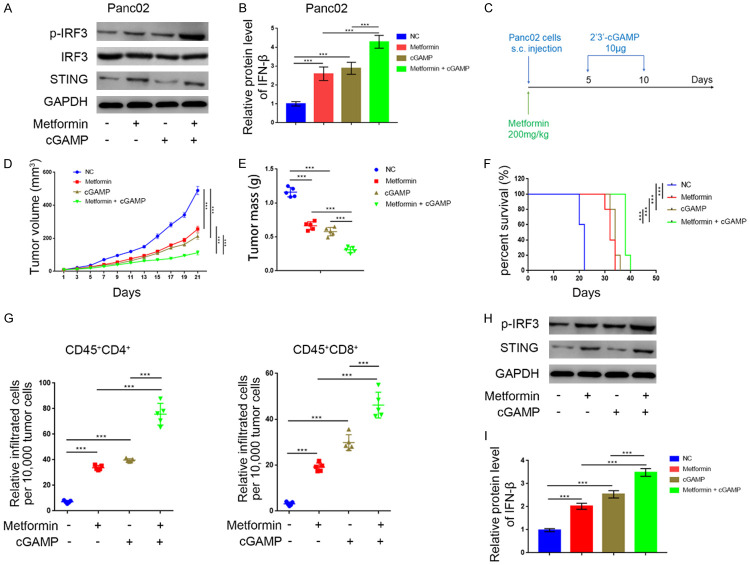
Figure 5.
Metformin suppressed the tumor growth and promoted the infiltration level of T cells in vivo. A. Western blot analysis to show the protein expression level of STING, IRF3, and p-IRF3 in Panc02 cell line treated with metformin (5 mM), 2’3’-cGAMP (150 nM), or the combination of metformin (5 mM) and 2’3’-cGAMP (150 nM). GAPDH served as an internal reference. B. ELISA analysis to show the protein expression level of IFN-β in Panc02 cell line treated with metformin, 2’3’-cGAMP (150 nM), or combination of metformin (5 mM) and 2’3’-cGAMP (150 nM). GAPDH served as an internal reference. ***, P < 0.001. C. Schematic diagram of the procedure of in vivo experiments, cGAMP and metformin doses were indicated above. D. The Panc02 tumors growth curves (n = 5/group). Groups were compared with each other. ***, P < 0.001. E. The Panc02 tumors mass (n = 5/group). Groups were compared with each other. ***, P < 0.001. F. Kaplan-Meier percent survival curves for each group with different treatments. ***, P < 0.001. G. Flow cytometry analysis to show the percentage of CD45+CD4+ and CD45+CD8+ T cells infiltrated per 10,000 tumor cells. Data presented as the mean ± SD of five independent experiments. ***, P < 0.001. H. Western blot analysis to show the protein expression level of STING, IRF3, and p-IRF3 in the collected tumors. I. ELISA analysis to show the protein expression level of IFN-β in in the collected tumors. GAPDH served as an internal reference. ***, P < 0.001.

