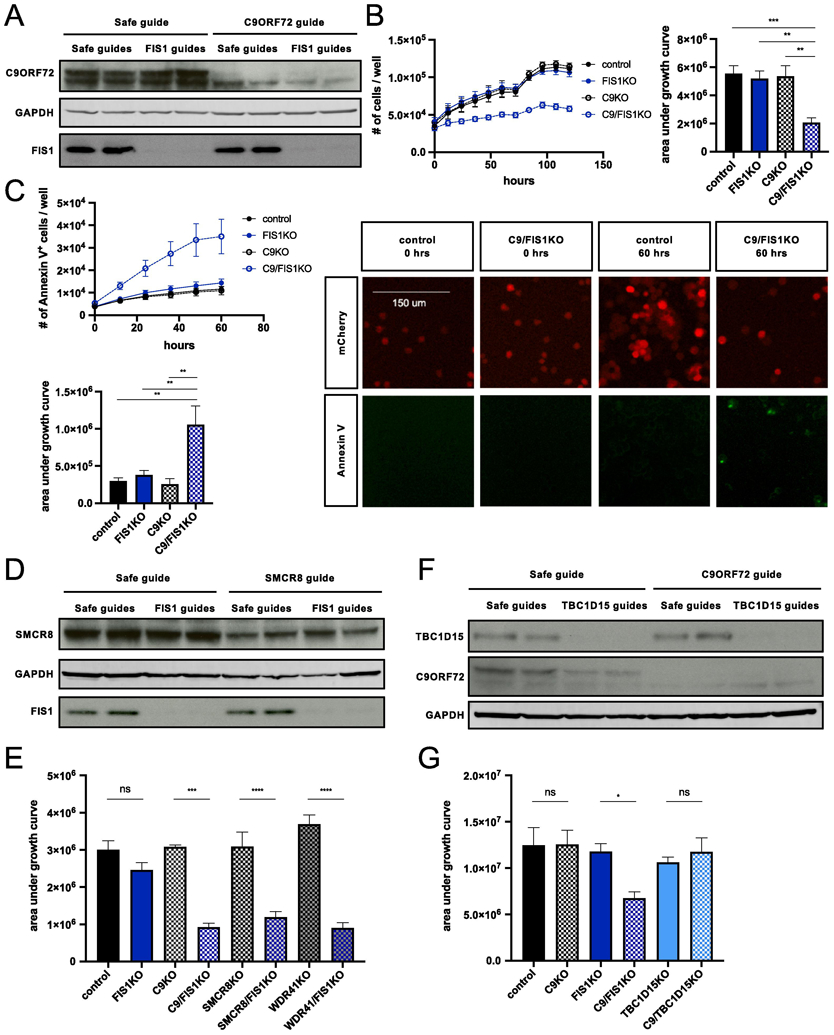
Figure 2 ∣. Validation of synthetic lethal interaction between FIS1 and C9ORF72.

(A) Immunoblot verification of C9KO and FIS1KO in undifferentiated Cas9+ U937 cells infected with control, FIS1-targeting, and/or C9ORF72-targeting sgRNAs. (B) Growth curves for PMA-treated control, C9KO, FIS1KO, and C9/FIS1KO U937 cells. Values represent mean ± s.e.m. of n=12 replicate wells from two independent experiments. Quantification using area under the growth curves (ordinary one-way ANOVA with Tukey’s multiple comparisons, **p≤0.01 ***p≤0.001). (C) Loss of C9ORF72 and FIS1 is lethal, as indicated by the increase in the number of apoptosing C9/FIS1KO cells labeled with annexin V conjugated to Alexa Fluor 488 per well. Values represent mean ± s.e.m. of n=7-8 replicate wells from two independent experiments. Quantification using area under the curve (ordinary one-way ANOVA with Tukey’s multiple comparisons, **p≤0.01). (D) Detection of SMCR8 and FIS1 protein levels by immunoblot in undifferentiated Cas9+ U937 cells infected with control, FIS1-targeting, and/or SMCR8-targeting sgRNAs. (E) Quantification of growth using area under the curve for PMA-treated control, FIS1KO, C9KO, C9/FIS1KO, SMCR8KO, SMCR8/FIS1KO, WDR41KO, and WDR41/FIS1KO U937 cells (ordinary one-way ANOVA with Sidak’s multiple comparisons, ***p≤0.01 ****p≤0.0001). Values represent mean ± s.e.m. of n=7 replicate wells from two independent experiments. (F) Detection of TBC1D15 and C9ORF72 protein levels by immunoblot in undifferentiated Cas9+ U937 cells infected with combinations of safe, TBC1D15-targeting, and C9ORF72-targeting sgRNAs. (G) Quantification of cell proliferation using area under the growth curve for PMA-treated control, FIS1KO, C9KO, C9/FIS1KO, TBC1D15KO, C9/TBC1D15KO U937 cells (ordinary one-way ANOVA with Sidak’s multiple comparisons, *p≤0.05). Values represent mean ± s.e.m. of n=7 replicate wells from two independent experiments.
