
Figure 3 ∣. Identification of context-specific binding partners for C9ORF72 and FIS1.
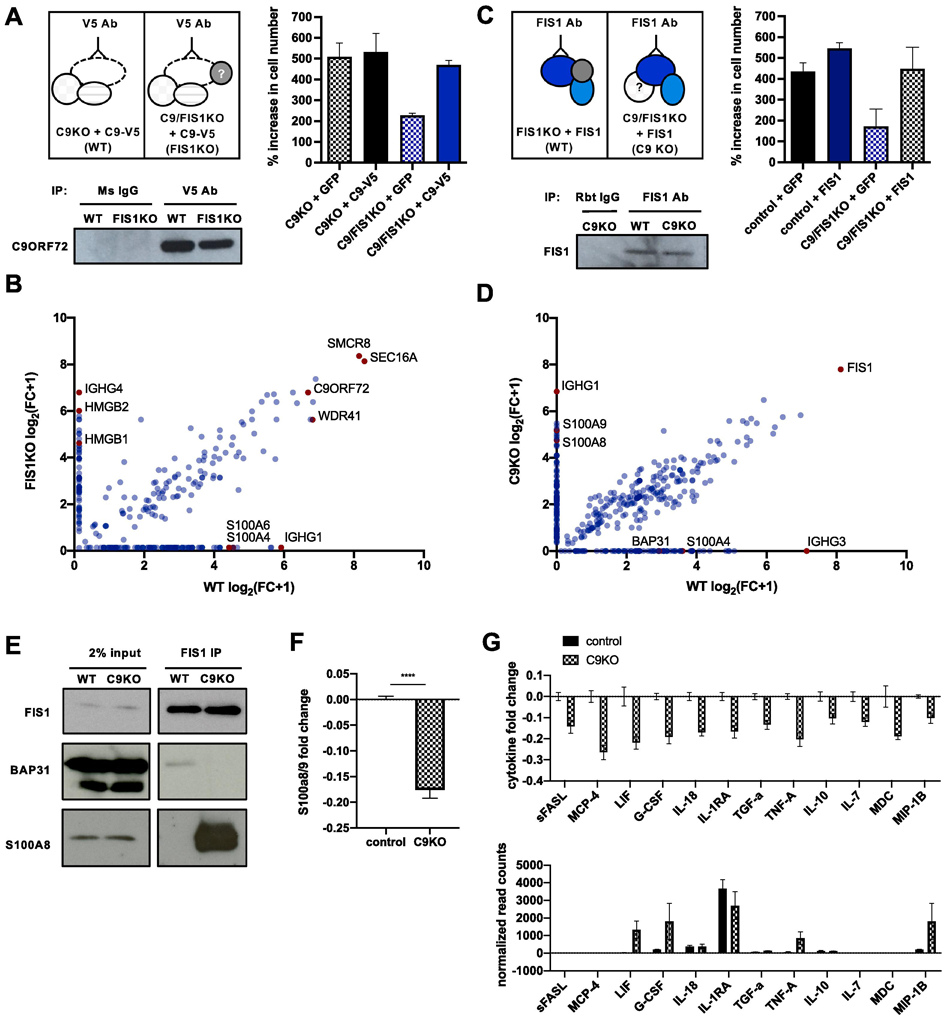
(A) Schematic of strategy to immunoprecipitate C9ORF72 and its binding partners in PMA-treated pseudo-WT and pseudo-FIS1KO U937 cells by introducing a C9ORF72-V5 construct to C9KO or C9/FIS1KO cells and by using a V5 antibody. Rescue of synthetic lethality by introduction of C9-V5 to C9/FIS1KO cells quantified by % increase in cell number per well after 5 days. Values represent mean ± s.e.m. of n=3 replicate wells. Immunoblot probed with C9ORF72 antibody showing successful immunoprecipitation of C9ORF72 using V5 antibody. (B) Fold change (FC-A) scores, converted to log scale, for proteins co-immunoprecipitated with C9ORF72-V5 from WT and FIS1KO cells, compared to controls. Proteins falling on the diagonal were pulled down with C9ORF72-V5 in both WT and FIS1KO cells, while proteins along the axes were only pulled down in either WT or KO cells. Values are from n=1 samples. (C) Schematic of strategy to immunoprecipitate FIS1 and its binding partners in PMA-treated pseudo-WT and pseudo-C9KO U937 cells by introducing a FIS1 construct to FIS1KO or C9/FIS1KO cells. Rescue of synthetic lethality by introduction of FIS1 to C9/FIS1 KO cells quantified by % increase in cell number per well after 5 days. Values represent mean ± s.e.m. of n=2 replicate wells. Immunoblot showing successful immunoprecipitation of FIS1 using a FIS1 antibody. (D) Fold change (FC-A) scores, converted to log scale, for proteins co-immunoprecipitated with FIS1 from WT and C9KO cells, compared to controls. RAGE ligands and other proteins of interest indicated in red. Values are from n=1 samples. (E) Validation of two context-dependent binding partners, S100A8 and BAP31 identified from the mass spectrometry results after immunoprecipitating endogenous FIS1 from control and C9KO cells. (F) Fold change of S100A8/9 heterodimer levels in supernatant of control and C9KO cells, compared to the mean concentration of control samples. Values represent mean ± s.e.m. of n=4 replicates. (G) Levels of various cytokines in the supernatant of C9KO cells are decreased, as determined by MFI fold change in control and C9KO samples, compared to the mean MFI of control samples. Values represent mean ± s.e.m. of n=4 replicates. Normalized read counts for the transcripts of the same cytokines profiled show either no change, or an increase in gene expression in C9KO cells. Values represent mean ± s.e.m. of n=2-3 replicate samples.