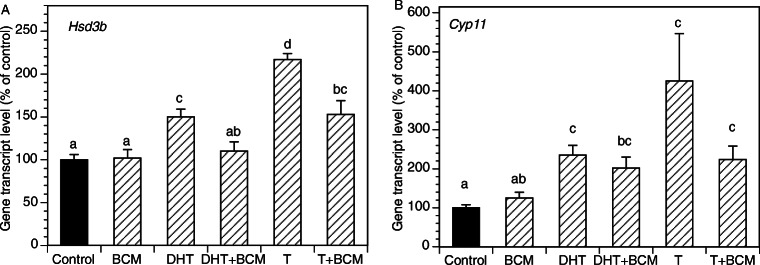
Fig. 6.
Effects of various concentrations of E2 on mRNA expression of Hsd3b and Cyp11 by GCs. All cultures were carried out for 48 h in chemically defined media. Each bar represents mean ± SEM; means significantly different from cultures in the absence of androgens (control) are denoted by * (P < 0.05), ** (P < 0.01), or *** (P < 0.001)

