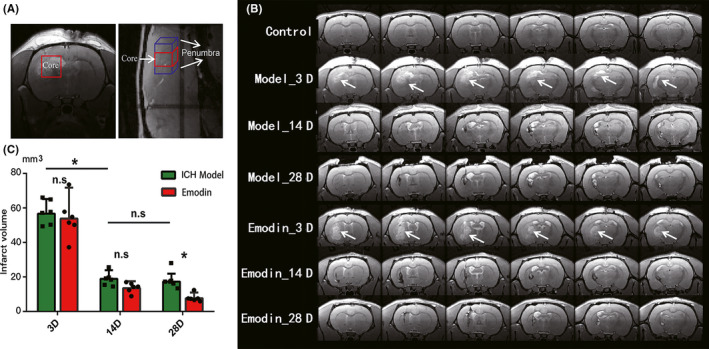
FIGURE 1.

Diagram and volume of intracerebral hemorrhage areas. A, The sketch map of regions being selected for MRS scanning (red cuboid, the core region; blue cuboid, penumbra regions). The dimensions were 3.5 mm (L/R), 3.5 mm (S/I), and 2.4 mm (A/P) in a coronal view. Here, we regard two isometric cuboids around hemorrhagic core region (1/4 overlapping with the core) as the penumbra regions (sagittal slice on the right). B, Coronal scans of model ICH and emodin‐treated rats are shown at time points of 3, 14, and 28 d after injection. The white arrows indicate the highlighted lesion areas of ICH in T2WI images. The figures are from the same rat (each group) in this 28‐d period. And we use nonsurgery rats as control group in MRI and MRS tests to exclude injection‐induced injuries. C. The hemorrhage volume was reconstructed by areas with 20% or above higher signal than contralateral brain areas. And the volume contains dark signals of areas of necroses and cavitations surrounding hemorrhage at 14 or 28 d. *P < .05
