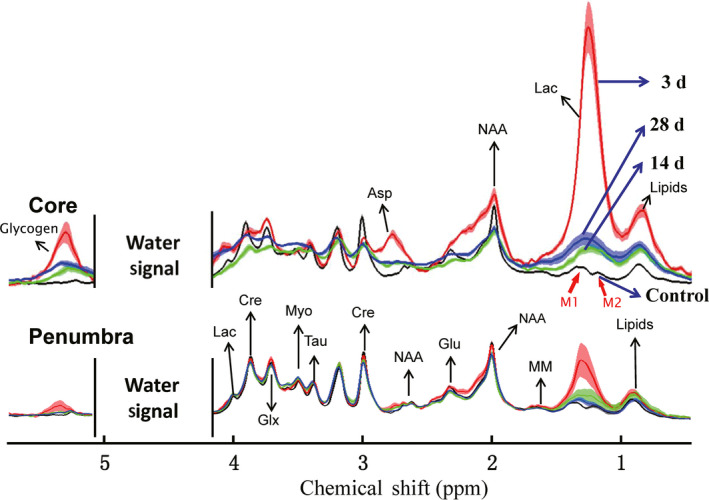
FIGURE 2.

In vivo 1H MRS results show the lactate concentration changes in ICH. The spectroscopies of core and penumbra regions at 3 time points. Discordant water signal was deleted to show other metabolites obviously. Lactate signal in the higher magnetic field (~1.3 ppm, blue arrows) was used for qualitative and quantitative analysis
