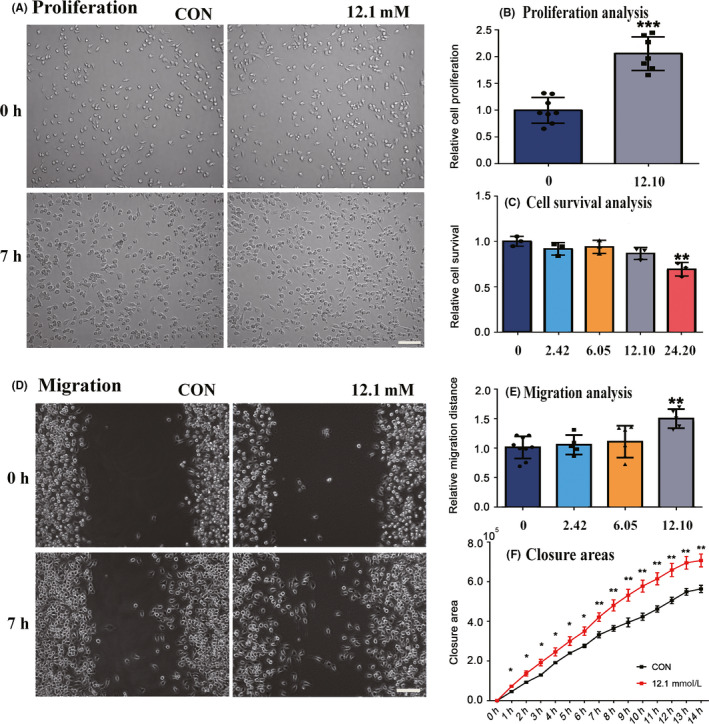
FIGURE 6.

Elevated level of lactic acid induced migration and proliferation of microglia. A, In vitro scratch assay was performed and the images of migration were captured at 0 h and 7 h after scratching with Live Cell Kinetic system. B, By cell counting, the relative proliferation was quantified as defined above in triplicates. C, The effects of lactate on microglial toxicity. D, The observation for cell proliferation was carried out by imaging captured at 0 h and 7 h. E‐F, The migration distance and the closure area were quantified by Cell‐IQ analyzer from three independent experiments. Data were presented as means ± SD *P, .1, **P, .05, ***P, .01 versus lactate‐treated cells
