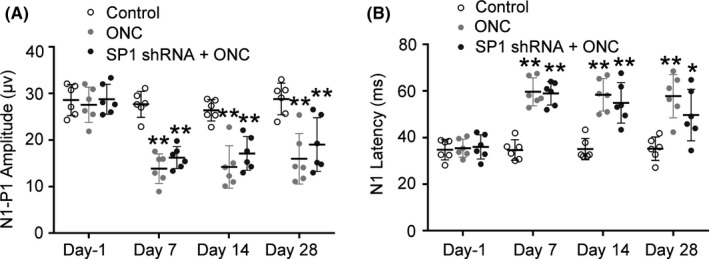
FIGURE 6.

Effect of inhibition of SP1 on F‐VEP in rats after optic nerve injury. A, Average N1‐P1 amplitude at 1 d pre‐ONC, and at 7, 14, and 28 d post‐ONC. There were no significant differences between the ONC group and SP1 shRNA group at any time point (n = 6, means ± SD, by RM one‐way ANOVA with the Greenhouse‐Geisser correction and Tukey multiple comparison test, **P < .01). B, Average N1 latency component at 1 d pre‐ONC, and at 7, 14, and 28 d post‐ONC. There were no significant differences between the ONC group and SP1 shRNA group at any time point (n = 6, means ± SD, by RM one‐way ANOVA with the Greenhouse‐Geisser correction and Tukey multiple comparison test, *P < .05, **P < .01)
