
FIGURE 6.
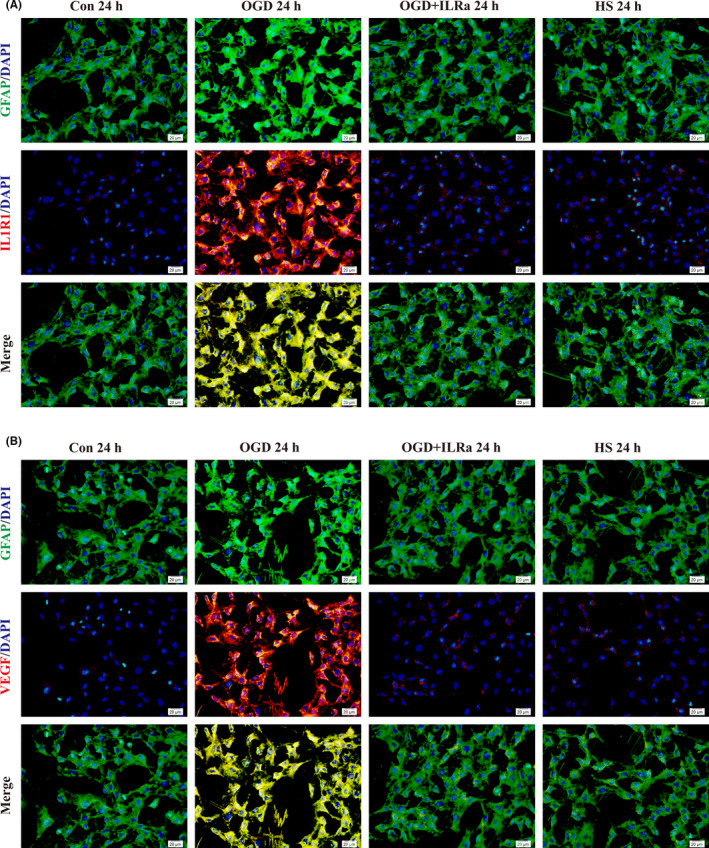
Expression of IL1R1 and VEGF proteins in different groups in TNC1 astrocytes as detected by immunofluorescence. The immunofluorescence images (A) show that compared with that in the control group, the IL1R1 protein expression (red) in GFAP‐positive TNC1 astrocytes (green) was markedly enhanced in the OGD group 24 h after incubation with the culture medium of incubated microglia for hypoxia for 2 h and reoxygenation for 24 h. However, its expression declined at 24 h in the IL1Ra and HS groups. B, Likewise, the VEGF protein expression (red) in the GFAP‐positive TNC1 astrocytes (green) was obviously increased at 24 h in the OGD group compared with that in the control group; however, its expression was decreased in the HS group compared with those in the corresponding groups. Scale bars: 20 µm. DAPI‐blue. n = 3 for each group