
FIGURE 1.
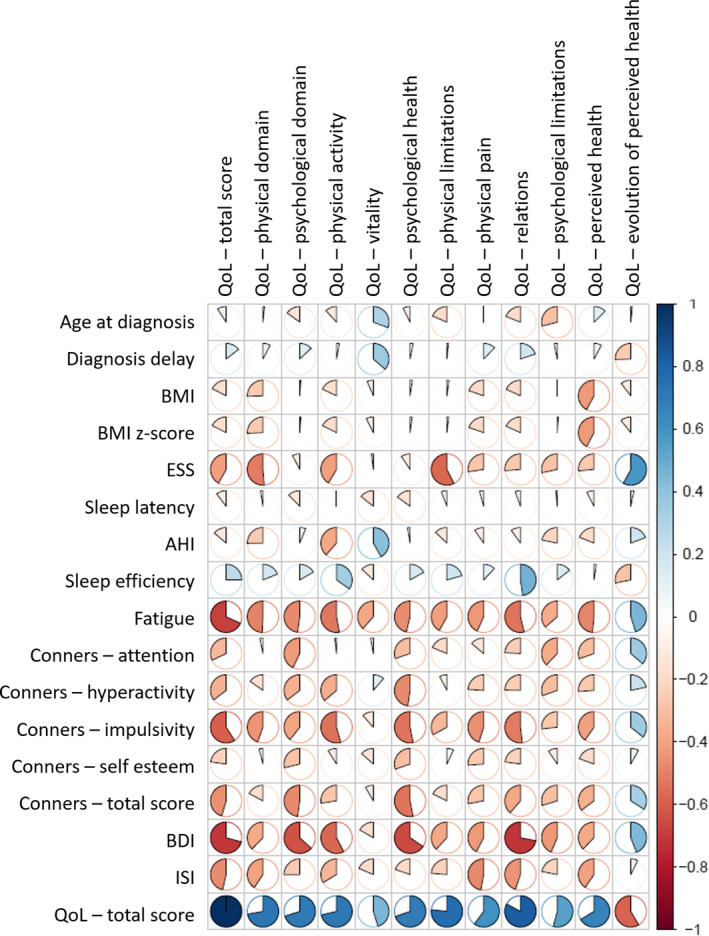
Correlation plot for adults. Bivariate associations between the quality of life dimensions and the continuous covariates in adult narcolepsy‐cataplexy. Positive and negative associations in blue and red, respectively. AHI, apnea‐hypopnea index; BDI, Beck depression inventory; BMI, body mass index; ESS, Epworth sleepiness scale; QoL, quality of life; ISI, Insomnia severity index