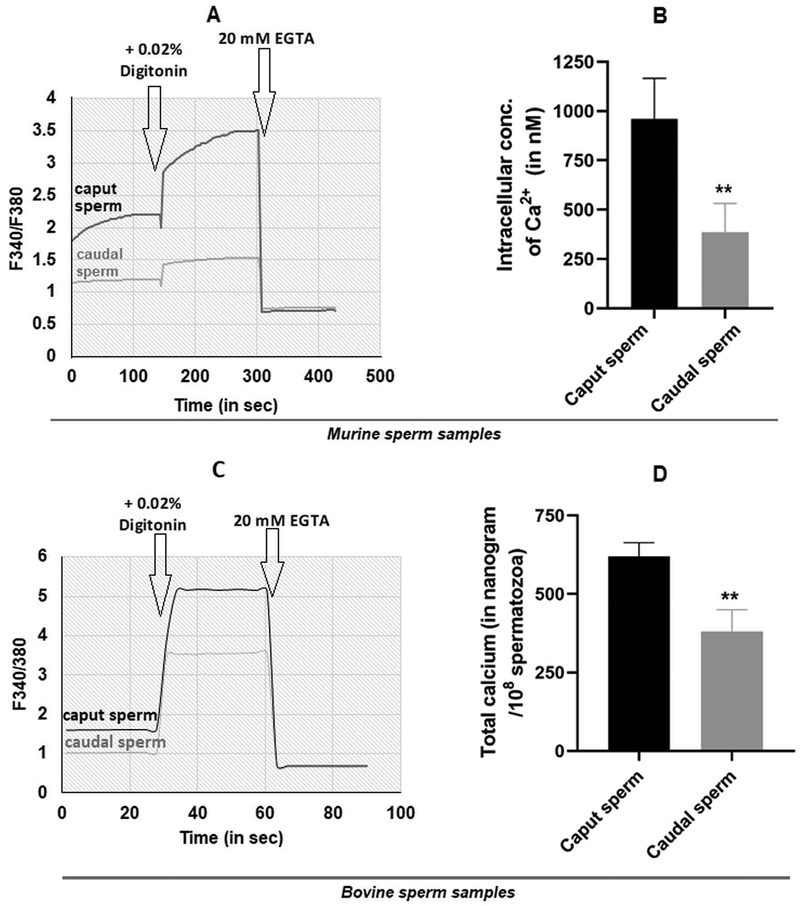
Figure 2: Calcium levels in epididymal spermatozoa.
Representative plots, showing intracellular free Ca2+ measured spectro-fluorometrically using Fura 2-AM. Mouse caput and caudal spermatozoa were incubated with 4μM Fura 2AM in a buffer containing 1 mM calcium. Fura 2 loaded sperm were monitored on a dual wavelength spectro-photometer and the calcium tracers obtained as described in materials and methods. Mouse sperm (A) and bovine sperm (C). The bar diagram shows intracellular calcium levels in mouse epididymal sperm measured in 4 different experiments. Values are means ± SEM. (D) Total calcium levels of twice washed bovine caput and caudal spermatozoa were measured by flame photometry as described in the materials and methods Data are means ± SEM (n=5). **p ≤0.01.

