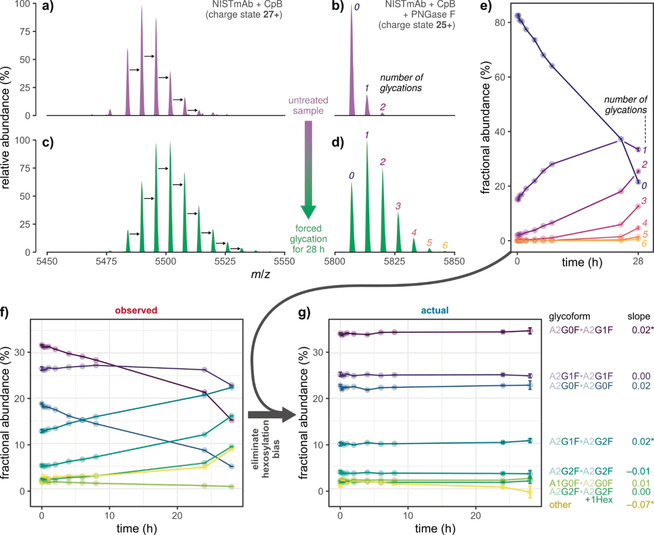
Figure 5.

Apparent changes in glycoform abundances during forced glycation of NISTmAb. a)–d) Raw mass spectra of glycosylated and de‐N‐glycosylated protein in the untreated sample (top) and after 28 h of forced glycation (bottom), respectively. Black arrows denote mass shifts of 162 Da. e) Abundance of glycated species and f) observed glycoform abundances measured at ten time points during forced glycation. g) Actual glycoform abundances, as obtained by correcting values in (f) at each time point by the respective glycation level in (e). For each glycoform, the slope from a linear regression of actual abundance versus time is reported; stars indicate significance (p<0.05). All samples were digested using carboxypeptidase B (CpB) in order to remove heterogeneity caused by partial C‐terminal lysine clipping. Error bars represent (propagated) 95 % confidence intervals from five technical replicates.
