Figure 3.

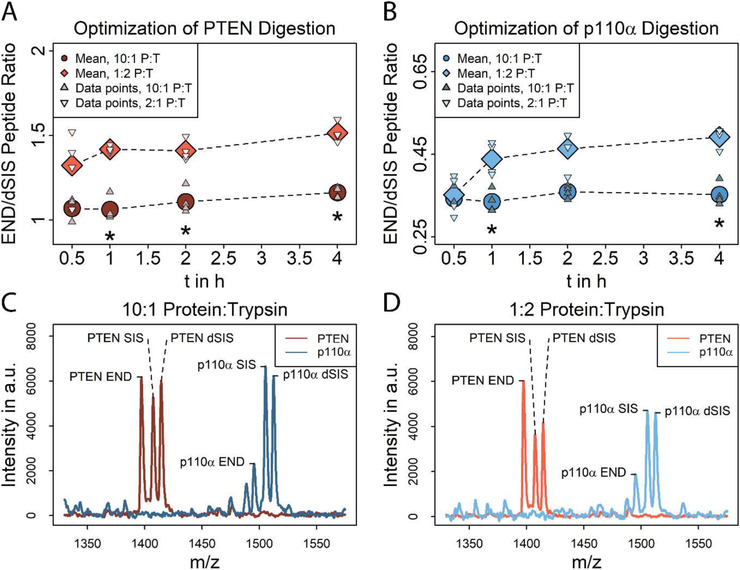
Optimization of tryptic digestion using MDA‐MB 231 lysate spiked with 2.5 fmol of both SIS and dSIS peptide. A) PTEN (148AQEALDFYGEVR159) peptide recoveries at different incubation times (0.5–4 h) and at protein:trypsin (P:T) ratios of 1:10 (dark red) and 2:1 (light red). (*) indicates a significant difference (p < 0.01) between two protein:trypsin ratios at the same incubation time. N = 4 per tested incubation time. B) p110α (503EAGFSYSHAGLSNR516) recoveries at different incubation times (0.5–4 h) at protein:trypsin ratios of 1:10 (light blue) and 2:1 (dark blue). (*) indicates significant difference (p < 0.01) between two protein:trypsin ratios at the same incubation time. N = 4 per tested incubation time. C,D) Overlaid mass spectra of enriched PTEN and p110α peptides after 1 h digest using C) 10:1 and D) 1:2 protein:trypsin, recorded in the linear mode. Spectra show similar background for both tested protein:trypsin ratios and no peaks are interfering with the target peptide peaks.
