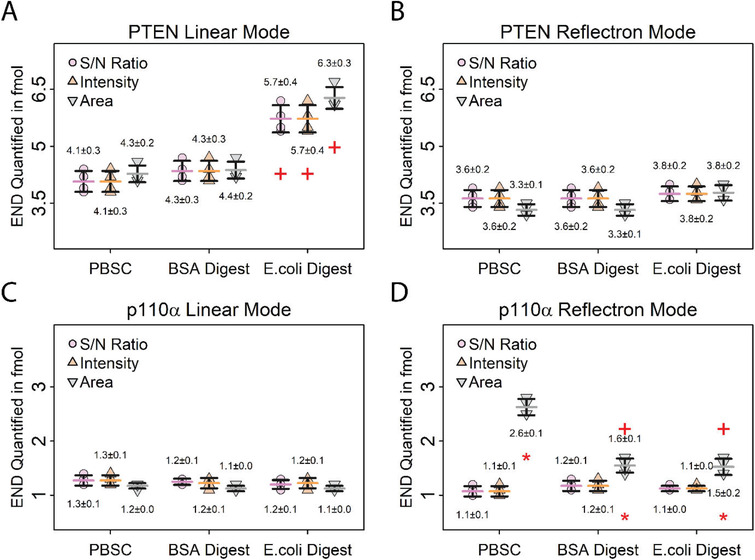
Figure 4.

Evaluation of different calibration strategies by quantifying PTEN and p110α in the same sample using different calibration matrices and peak parameters. Error bars represent standard deviations, horizontal bars indicate means. Values above and below the data points represent the means and absolute standard deviations. A,B) Quantification of endogenous PTEN in 10 µg MDA‐MB 231 digest using different calibration matrices and peak parameters. Data recorded in the linear mode A) shows differences in PTEN quantification using E. coli digest as matrix, whereas data recorded in the B) reflectron mode shows no difference between the matrices. (+) indicates a significant difference (p < 0.01) between E. coli digest and PBS+CHAPS matrices for PTEN quantification using the same peak parameters for calculating the calibration. This difference is due to an interference from the calibration matrix with the internal standard for PTEN. C,D) Quantification of endogenous p110α in 10 µg MDA‐MB 231 digest using different calibration matrices and peak parameters. Data recorded in the C) linear mode shows no difference in p110α quantification using different matrices and peak parameters, while the D) reflectron mode data shows differences when peak area is used for quantification, likely due to less accurate SNAP peak modelling for low‐intensity peaks. (+) indicates a significant difference (p < 0.01) between E. coli digest and BSA to PBS+CHAPS matrices using the same peak parameter for calculating the calibration. (*) indicates a significant difference (p < 0.01) between peak area and S/N ratio for p110α quantification. N = 4 per calibration matrix.
