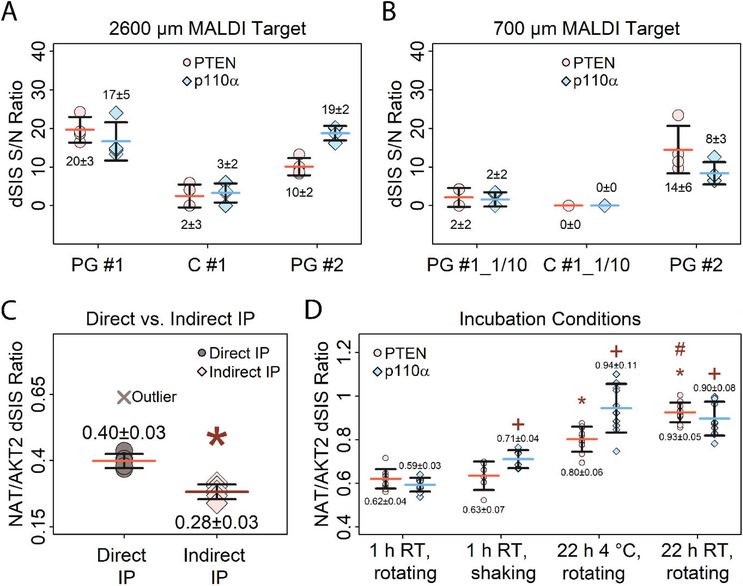
Figure 5.

Optimization of immuno‐enrichment. Error bars represent standard deviation, horizontal bars indicate means. Values above and below the data points represent the mean and absolute standard deviation A) Comparison of different bead types for enriching 2.5 fmol PTEN and p110α dSIS peptides spiked into 10 µg E. coli digest, using a 2600 µm MALDI target plate. Protein G Dynabeads (PG #1), Protein G MagReSyn beads (PG #2) and M280 tosylactivated Dynabeads (C #1) were tested. Peak S/N ratios of the enriched dSIS peptides were used for comparison. B) Comparison of different beads for enriching 2.5 fmol PTEN and p110α dSIS peptides spiked into 10 µg E. coli digest, using a 700 µm MALDI target plate. Peak S/N ratios of the enriched dSIS peptides are used for comparison. The same antibody‐coupled beads as in (A) were tested, using 1/10 of the bead amount (PG #1_1/10, C #1_1/10), except for PG #2 (same as in (A)). N = 4 per bead type and MALDI target plate. Data for (A) and (B) were recorded in the reflectron mode. C) Comparison of direct and indirect immuno‐enrichment for PTEN NAT peptide (1 fmol) spiked into 10 µg E. coli digest, showing better recovery using direct IP. Outlier (>Q3+3x Interquartile Range) was excluded due to poor quality of the mass spectrum. MeanDirect IP (outlier included) = 0.44 ± 0.1. The signal of AKT2 dSIS standard spiked into the MALDI matrix (1 fmol per spot) was used for normalization. (*) indicates significant difference (p < 0.01) to direct IP. Data was recorded in the linear mode. D) Testing different incubation times, temperatures and mixing conditions for enriching PTEN and p110α NAT peptide (1.25 fmol) spiked into 10 µg of E. coli digest. The signal of the double‐stable‐isotope‐labelled AKT2 peptide (THF(+10)PQFSYSASIR(+10)E) spiked into the MALDI matrix (1 fmol per spot) was used for normalization. (*) indicates significant difference (p < 0.01) of PTEN enrichment after 22 h incubation compared to 1 h incubation, (+) significant difference (p < 0.01) between p110α enrichment compared to 1 h incubation, and (#) indicates significant difference between PTEN enrichment after 22 h at room temperature (RT) and 22 h at 4 °C. N = 10 for each condition, except 1 h shaking (N = 6). Data was recorded in the linear mode.
