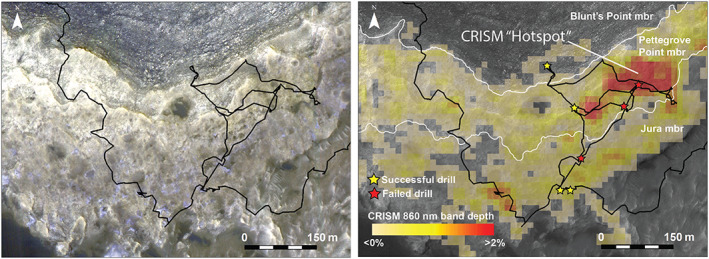
Figure 2.

(left) Color stretched HiRISE mosaic from Fraeman et al. (2016) showing detail of Vera Rubin ridge. Specific HiRISE image from that mosaic shown here is ESP_021610_1755. (right) The 860 nm band depth map from CRISM scene ATO00021C92 that shows variability of 860 nm signature across VRR and drilled locations.
