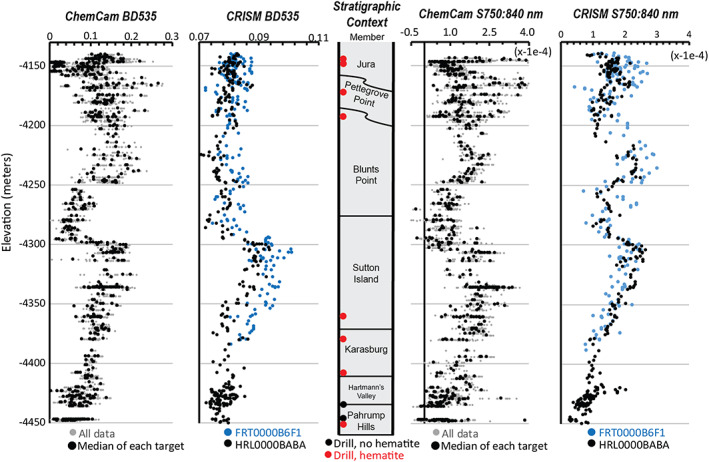
Figure 6.

(left) Variability of 535 nm band depth versus elevation seen in ChemCam passive bedrock observations compared with CRISM data from two scenes along Curiosity's traverse. (center) Stratigraphic members versus elevation for context. (right) Variability of 750:840 nm slope from ChemCam passive and CRISM spectra. CRISM and ChemCam parameters were calculated using the same formulas.
