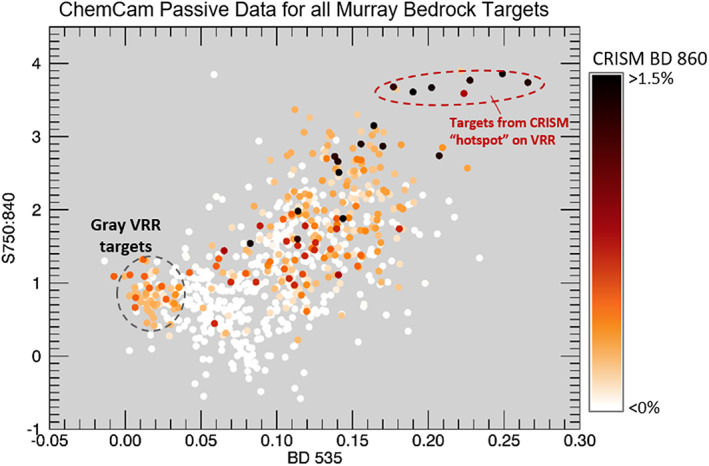
Figure 8.

Median 535 nm band depth versus median 750:840 nm ratio for each ChemCam target from all bedrock observations in the Murray formation collected between Sols 758 and 2,300. Points are colored based on the 860 nm band depth of the CRISM pixel over location where target was located. The targets with the combined deepest 535 nm band depth and 750:840 nm ratio from ChemCam passive spectra correspond to regions on VRR with the deepest CRISM 860 nm bands. Targets with low 535 and 750:840 nm depths associated with moderate 860 nm CRISM absorptions are “gray targets” from VRR that are smaller than spatial resolution of CRISM (see example “Oban” in Figure 5). Location of CRISM “hot spot” is labeled in Figure 2. CRISM parameters were calculated from FRT0000B6F1 and HRL0000BABA for areas of traverse not covered by FRT0000B6F1.
