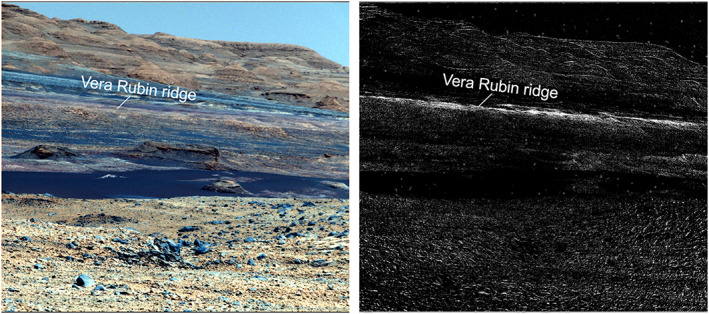
Figure 10.

(left) Mastcam false color from Sol 468, product identifiers 00186400(0–6), showing VRR from several kilometers away. (right) R6 to R4 (1,013 to 900 nm) slope map showing the deep ferric absorptions (white) associated with the bedrock on VRR compared with surrounding Murray formation. After Johnson et al. (2016) and Wellington et al. (2017).
