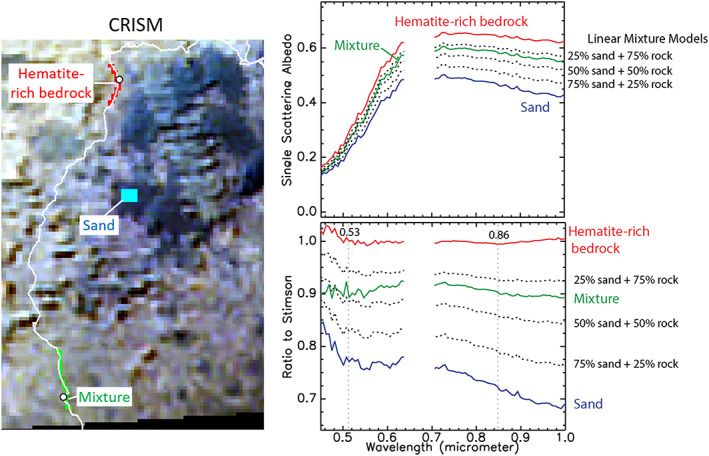
Figure 12.

Example a of linear mixing model that simulates checkerboard mixing. (left) Regions of interest on CRISM ATO0002EC79 processed to 12 m/pixel using MLM methods and covering locations from Figure 10 as well as a nearby sand dune. (right top) Spectra from the sand area (blue), hematite‐bearing bedrock (red, hematite confirmed via the Oudam drill sample), and typical terrain along Curiosity's traverse to VRR (green). Linear mixing models (dotted lines) using the sand (blue) and bedrock (red) end‐members show the typical terrain (green) can be well modeled by using proportions that are similar to what was observed on the ground (Figure 11). (right bottom) Same as above but ratioed to a spectrum over the Stimson formation to emphasize ferric absorption features. CheMin data showed Stimson did not contain any hematite.
