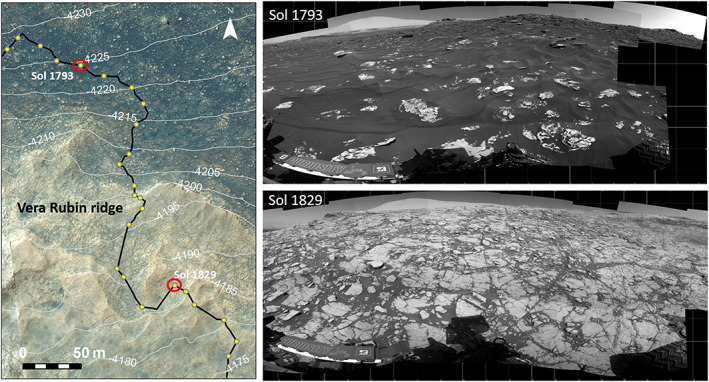
Figure 13.

(left) Color HiRISE image ESP_021610_1755 showing show elevation interval were CRISM and ChemCam spectral parameters do not track, likely due to large amount of sand compared with bedrock. (top right) Navcam image showing typical sand‐dominated terrain in this elevation interval from Sol 1,793, elevation −4,225 m. (bottom right) Navcam showing typical bedrock‐dominated terrain for VRR from Sol 1,829, elevation −4,187 m.
