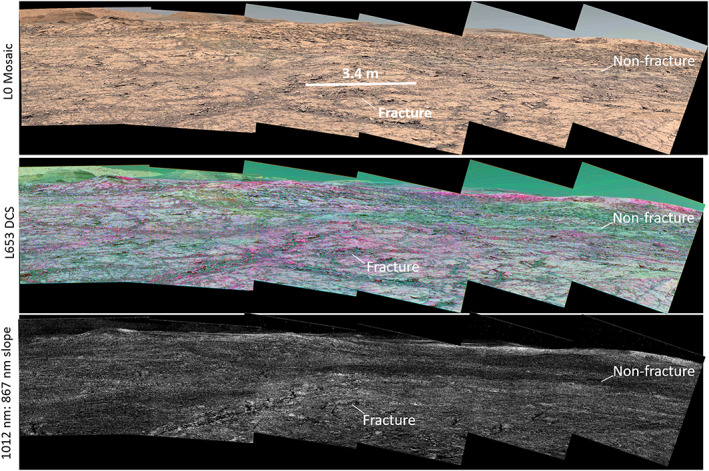
Figure 14.

(top) Mastcam L0 Sol 1,814, product identifiers 009360(00–23), (middle) decorrelation stretch from L653 filters. Areas that are more purple have deeper ferric absorptions, (bottom) 1,012–867 nm slope map. Curiosity investigated a workspace near the labeled fracture and labeled “nonfracture” but found no chemical or spectral differences once dust was removed from the outcrops.
