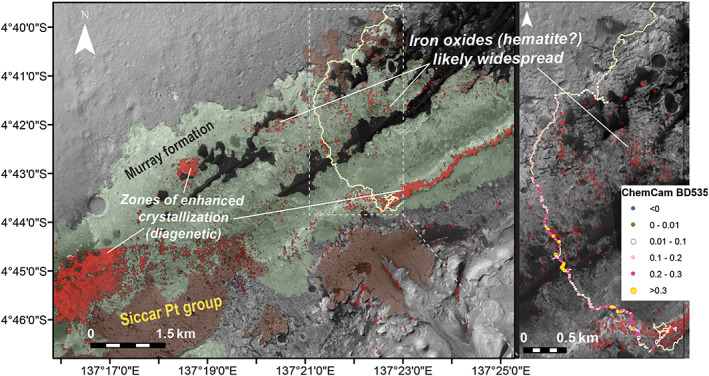
Figure 16.

(left) Annotated HiRISE mosaic of Mt. Sharp showing likely extent of the Murray formation based on rover observations to date (green) and Siccar Point group units (brown). CRISM hematite map from Fraeman et al., 2016 shown in red. (right) Graphical representation of ChemCam 535 nm band depths from rocks along Curiosity's traverse.
