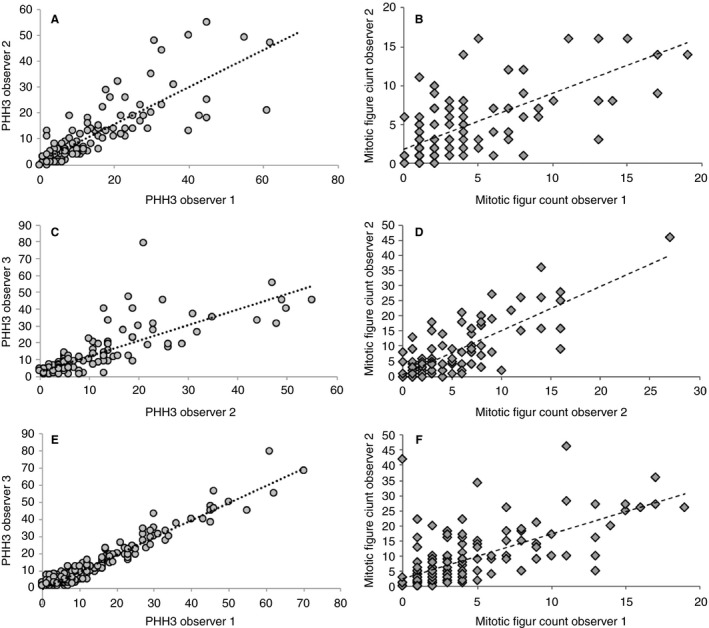
Figure 2.

A–C, Interobserver agreement of the total phosphohistone H3 (PhH3) score for observers 1 and 2 (A), observers 2 and 3 (B), and observers 1 and 3 (C). D–F, Total mitotic figure count assessed in an area of 2 mm2 by observers 1 and 2 (D), observers 2 and 3 (E), and observers 1 and 3 (F). A, PhH3 intraclass correlation coefficient (ICC) score of 0.79 [95% confidence interval (CI) 0.67–0.86]. B, PhH3 ICC score of 0.76 (95% CI 0.72–0.86). C, PhH3 ICC score of 0.97 (95% CI 0.96–0.98). D, Mitotic count ICC of 0.62 (95% CI 0.48–0.72). E, Mitotic count ICC of 0.61 (95% CI 0.39–0.75). F, Mitotic count ICC of 0.42 (95% CI 0.16–0.60).
