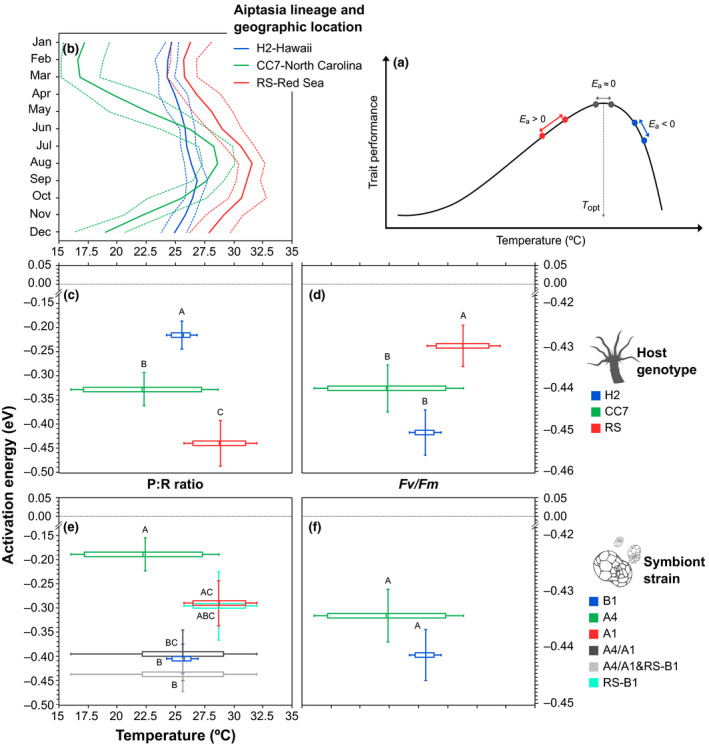
FIGURE 4.

(a) Thermal response of physiological and metabolic processes has at least two different regimes: one above their optimal performance temperature (T opt), rise, and one below their optimum, fall. The Boltzmann–Arrhenius model involves calculating activation energies (E a) from the temperature dependence of reaction rates. Here E a < 0 (i.e., negative values) indicate a decrease in the trait response with increasing temperature, E a ≈ 0 indicate no change in the trait response with increasing temperature and E a > 0 (i.e., positive values) indicate an increase in the trait response with warming. The range of the rise regime is where organisms normally operate (highlighted by the green area), whereas the fall component (blue) is usually steeper and typically indicates biological collapse. (b) Thermal regimes of geographical locations of origin for the three Aiptasia lineages used here: Hawaii (Kāne'ohe Bay), North Carolina (Wilmington), and Red Sea (Al Lith, Saudi Arabia). Solid line denotes average, and dashed lines represent maximum and minimum sea surface temperatures (data taken from www.seatemperature.org; figure modified from Cziesielski et al., 2018). Box and whisker plots show the median and range of temperature variability where host (c, d) and symbiont taxa (e, f) originate versus the mean (±1 SE) activation energy (eV) associated to P:R ratios and photochemical efficiency (Fv/Fm). Thermal variation for symbiont taxa containing the artefactual “A4/A1” genotype was calculated based on the two corresponding locations (North Carolina and Red Sea). Letters next to data points indicate similarities (e.g., AA) or differences (e.g., AB) as determined by estimated marginal means
