
Figure 1.
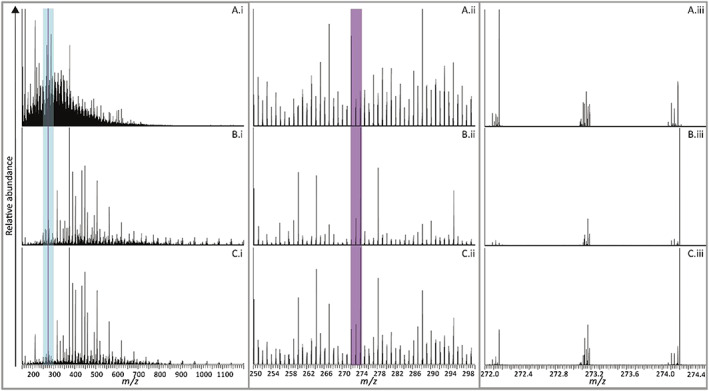
DI‐HRMS spectra of A, the upstream, B, the sewage outfall, and C, the downstream SPE extracts displaying the mass ranges m/z 150 to 1200 (A.i, B.i, and C.i), m/z 250 to 300 (A.ii, B.ii, and C.ii), and m/z 272.0 to 274.4 (a.iii, B.iii, and C.iii)